-
Introduction
-
Lanzhou’s Impressive Urban Infrastructure Improvement since 2012
-
Debt Accumulation Behind Urban Infrastructure
-
Debt pressure mounting for City Construction Firms
-
Summary
Note: This is an original piece by David Marx. Please cite according to Creative Commons 4.0 when sharing
Click here to download the PDF version
Debt Accumulation Behind China’s Urban Infrastructure Investment Rally: The Case of Lanzhou
I. Introduction
Lanzhou, the capital of Gansu Province, is located in Northwest China and has been an important node of the Silk Road. In 86 BC, Han Dynasty established the first government over this piece of land and named it Jincheng, or Golden City, wishing it to be a solid fortress for the imperial’s west advancement. Two thousand years later, military tensions near Lanzhou eased as Xinjiang and Inner Mongolia became the new frontiers. For most Chinese people, the first thing that comes to mind when mentioning Lanzhou is its famous Beef Noodles, rather than guns and blood with it.

In terms of economic development, Lanzhou is far behind China’s world-famous giants, such as Beijing and Shanghai, or even the late comers, such as Hangzhou and Qingdao. In 2020, Lanzhou’s GDP is RMB 288.7 billion (USD 43.2 billion), ranking the 31st among 36 major cities in the China [1]; its total population at the end of 2019 is 3.31 million, ranking 29th; its per capita GDP in 2021 is about RMB 74,000 (USD 11070), 8.7% higher than the national average. 、[2];
However, unwealthy as it has been, Lanzhou’s urban infrastructure leaped in the past ten years. The city now has denser water-supply pipelines and traffic road networks; a new town, Lanzhou New District, saw modern buildings replacing farmlands; the share of green land in the city also increased considerably. Huanghe Lou, or Tower for the Yellow River, became the city’s new symbol in 2020 following the five-year construction. Erected on the bank of the Yellow River, the RMB 400 million project shines like a pearl in the evening [3]. In fact, Lanzhou’s artificial urban landscape is at least as magnificent as wealthy cities in the coastal areas.
")
As a city with moderate GDP levels and limited fiscal capacity, Lanzhou’s urban infrastructure construction relied heavily on financial borrowings. According to the Ministry of Housing and Urban-Rural Development (MHURD), from 2012 to 2020, the funds from the fiscal budget accounted for only 5.6% of the total fixed-asset investment in Lanzhou’s public infrastructure facilities. Meanwhile, loans from banks and trusts made up 54.3%, while bonds issued by project companies accounted for another 2.9%. [4];
The de facto leverage ratio for these infrastructure projects will be even higher than what the above data suggests, because funds from the fiscal budget and the project company in the MHURD data may in turn be collected through local government bonds or other implicit borrowing channels.
Unlike manufacturing or other commercial projects, many urban infrastructure projects do not generate adequate cashflows to pay back debts. MHURD data shows that from 2012 to 2020, most of Lanzhou’s infrastructure was invested in urban transportation (76.1% of the total). Unlike inter-city expressways, most intra-city roads are operated free of charge, making it difficult to service debt solely by relying on infrastructure projects.
In fact, the debt problem of Lanzhou’s urban infrastructure investment has already surfaced in recent years as the central government cracked down the shadow banking sector. The scale of Lanzhou’s urban infrastructure investment started to decline in 2018, while City Construction Firms, state-owned debt-bearers, and operators of urban projects, are facing difficulties in debt servicing, as they mostly rely on refinancing to pay back maturing debts as operating and investment cash inflows are inadequate. In March 2022, Lanzhou Urban Investment, one of the major Chengtou firms in Lanzhou failed to fulfill one of its guarantee obligations, raising the alarm for the investors.
With the Chinese economy slowing down, many are counting on infrastructure investment to stabilize growth. There is no doubt that urban infrastructure should be a priority for city development as it enhances people’s livelihoods and the long-term competitiveness of the local economy. However, the case of Lanzhou reminds us that the pace and scale deserve careful design and planning. Most urban infrastructure projects charge low or no user fees because of public welfare considerations, and therefore the associated debt repayment relied on government subsidies/purchase or land usage right transfers, which fundamentally is limited by a city’s fiscal capacity and growth potential. Regardless of the specific forms, such as PPP and BOT, the growth of borrowing and investment in urban infrastructure investment should not deviate too far from the reasonable estimates for the sustainable growth in fiscal revenue, local economy, and the long-term valuation of the land usage right.
II. Lanzhou’s Impressive Urban Infrastructure Improvement since 2012
Lanzhou’s infrastructure improvement started in 2012, which is the post-2008 Global Financial Crisis era. By 2020, the length of drainage and sewage pipelines in Lanzhou has been 4.1 times the level in 2011, while the length of urban roads and bridges 2.5 times, the length of water supply pipelines 2.0 times, and the area covered by plants (green lands) 2.0 times. All those growth rates were higher than (or at least the same as) real GDP growth over the same period.
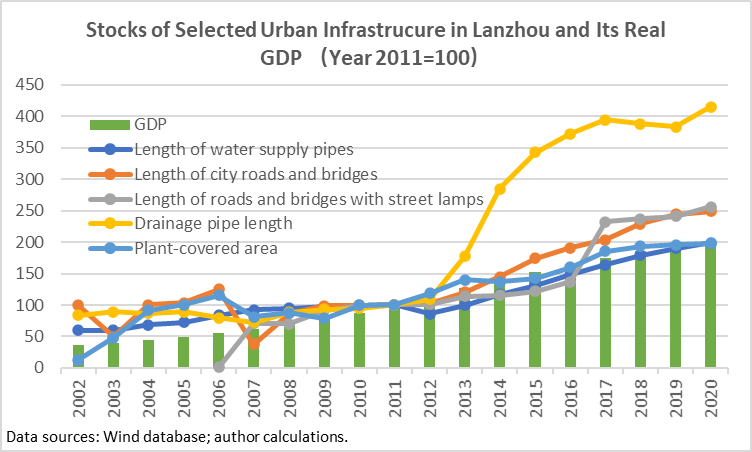
The above increase in infrastructure stocks is not a mere result of city expansion, as the density of roads/pipelines also improved. For example, the density of drainage pipes increased from 3.9 kilometers per square kilometer (km/km2) in 2011 to 8.7 km/km2 in 2020, rising by 134%; the green coverage rate in built-up areas increased from 25.1% in 2011 to 33.1% 2020; the green space per capita increased from 8.7 square meters (km2) in 2011 to 13.6 km2 in 2020.
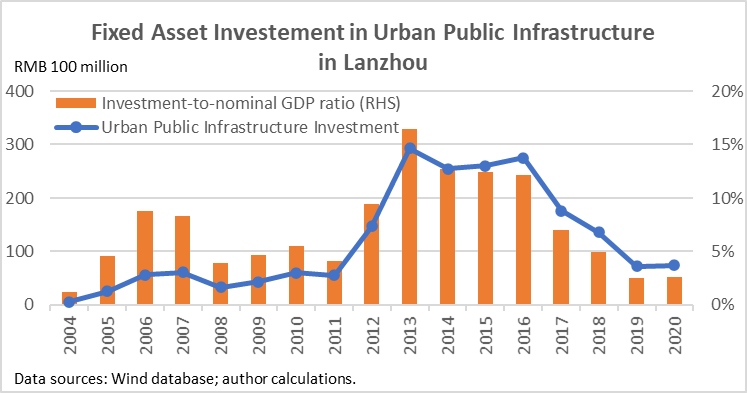
The above improvement is associated with massive infrastructure investments. According to data on “fixed-asset investment in urban public infrastructure (henceforth, FAI-UPI)” published by the MURHD, Lanzhou’s urban infrastructure investment leaped forward from 2012 to 2016. In 2013, FAI-UPI reached RMB 29.2 billion or 16.5% of its nominal GDP, doubling the previous peak in 2006. From 2013 to 2016, Lanzhou’s FAI-UPI stayed above 10% of nominal GDP, compared with less than 5% from 2008 to 2011.
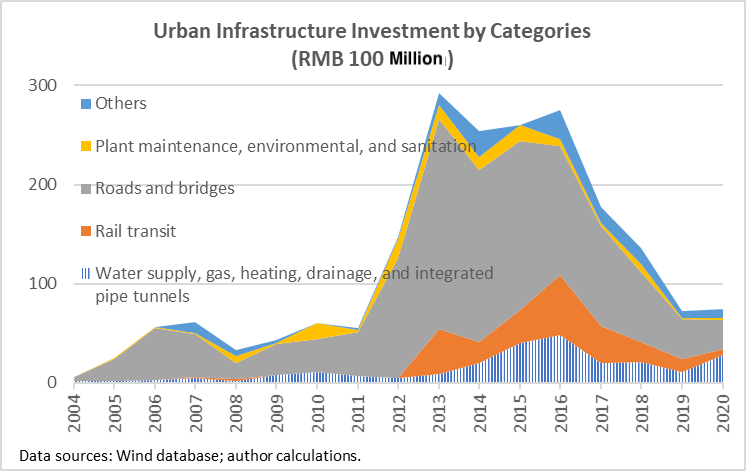
Transportation projects dominated Lanzhou’s urban infrastructure investment. From 2012 to 2020, Lanzhou’s FAI-UPI totaled RMB 168.81 billion, of which RMB 104.86 billion was invested in roads and bridges (accounting for 62.1%), and RMB 23.69 billion was invested in rail transit (accounting for 14.0%). The sum of two accounts for 76.1% of the total investment in urban construction. The second largest group was the investment in water supply, gas, heating, drainage, and integrated pipe tunnels, totaling is RMB 20.12 billion yuan (accounting for 11.9%), while investment in plant maintenance, environmental, and sanitation totaled RMB 8.54 billion yuan (accounting for 5.1%).
Debt Accumulation Behind Urban Infrastructure
A typical model of China’s urban infrastructure financing is to have a state-owned enterprise (City Construction Firm) conduct the project by acquiring fiscal funding and borrowing from the financial market. For Lanzhou, how much of the massive infrastructure investment was funded by fiscal expenditure, and how much was funded by SOE debt? This paper provides an estimate on this issue with two methods.
Method 1: Compare the increase in fiscal infrastructure expenditure with the increase in infrastructure investment.
As stated above, the Year 2013 marks the largest increase in infrastructure. Therefore, increase in fiscal infrastructure expenditure and infrastructure investment are calculated by calculating the respective difference in 2013 and 2011.
Lanzhou’s 2013 FAI-UPI was RMB 23.7 billion higher than in 2011. However, the increase in fiscal spending is less straightforward. This is because China’s fiscal budget is regrouped into four books, among which General Budget and Government Funds are the two most important ones. The former includes current income and expenses, while the second is mainly made up of revenue and expenditure related to land development and urban infrastructure investment.
Unfortunately, for the General Budget expenditures, detailed spending data by functions is only available after 2015. For the Government Funds expenditure, aggregated data became available in 2015, while function-wise breakup is not published. Therefore, one has to make reasonable assumptions when estimating the increase in infrastructure expenditure between 2011 and 2013.
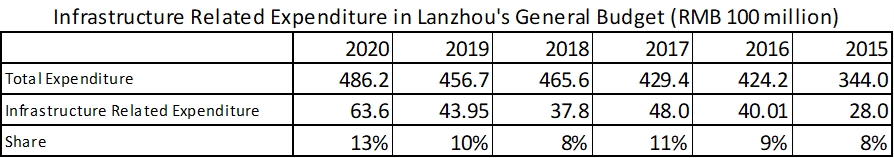
The increase of fiscal infrastructure expenditure in the General Budget. Lanzhou’s general public budget expenditure only increased by RMB 6.7 billion between 2011 and 2013, and only a portion of this increase goes to urban infrastructure. As only aggregated data is available from 2011-2013, the share of infrastructure spending from 2015 to 2020 was used. Calculations show that, from 2015 to 2020, the share of infrastructure spending among total General Budget Spending is about 10%. Therefore, the increase in infrastructure spending from General Budget Expenditure between 2011 and 2013 is estimated to be RMB 670 million.
Note: Expenditures related to urban infrastructure include: urban and rural community public facilities, rural road construction, farmland construction, water conservancy project construction, water conservancy project operation and maintenance, rural water conservancy, rural infrastructure construction, highway construction, highway maintenance, railway network construction, transport subsidies related to refined oil price reforms for transportations, transportation construction funded by vehicle purchase taxes, bus operation subsidies, service-industry infrastructure construction, affordable housing projects, public housing construction, maintenance, and renovation.
The increase of fiscal infrastructure expenditure in the Government Funds. In 2015, Lanzhou’s fiscal spending in the Government Funds budget was recorded at RMB 3.1 billion yuan. In general, about 55% of these are paid to collect land from farmers or other occupiers [6]. To simplify calculations, it is assumed that 50% of the Government Funds expenditure goes to urban infrastructure projects. In addition, since the government funds budget was introduced to support urban infrastructure investment, it is further assumed that no such expenditure was made in 2011. Therefore, additional support from Government Funds expenditure on urban infrastructure projects is estimated to be RMB 1.55 billion in 2013 compared with 2011.
Therefore, out of RMB 9.8 billion increase in the total fiscal expenditure, RMB 2.12 goes to urban infrastructure investment. This only makes up 9.1% of the RMB 23.7 billion increase in FAI-UPI between 2011 and 2013. It should be regarded as an estimated upper limit, as assumptions adopted, especially those for the Government Funds expenditure, are overestimating the actual support.
Method 2: FAI-UPI-FS Funded by Fiscal Expenditure Directly vs. Total FAI-UPI-FS.
MURHD supplements FAI-UPI data with a sheet called “Funding Sources of Fixed Asset Investment in Urban Public Infrastructure (FAI-UPI-FS)”. It categories the total funding into the following [6]:
-
Fiscal budget expenditure: covering expenditure from both central and local governments, from both the General Budget and the Government Funds Budget, including those funded by government bonds;
-
Project equity: investment from the project company raised by equity issuance or retained earning;
-
Domestic loans: covering loans from financial markets, such as banks and non-bank financial institutions;
-
Project Bonds: bonds issued by the project company
-
Foreign loans and equity;
-
Others
According to this data, among the increase in Lanzhou’s 2013 FAI-UPI compared with 2011, RMB 890 million was from the fiscal budget expenditure, accounting for 3.8%. Two caveats are associated with the FAI-UPI-FS data. On the one hand, certain fiscal support is not included in the fiscal budget expenditure category, such as governments’ capital contribution to the project company. On the other, some of the funding may not be utilized, so the FAI-UPI-FS is not 100% equal to the actual FAI-UPI. Nonetheless, it provides another estimate for the fiscal contribution to infrastructure investment, mostly an estimate for the lower limit.
Source: Wind database; author’s calculations.
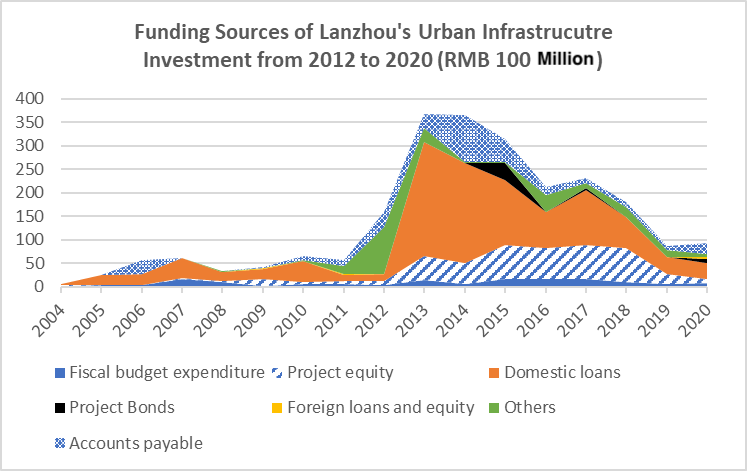
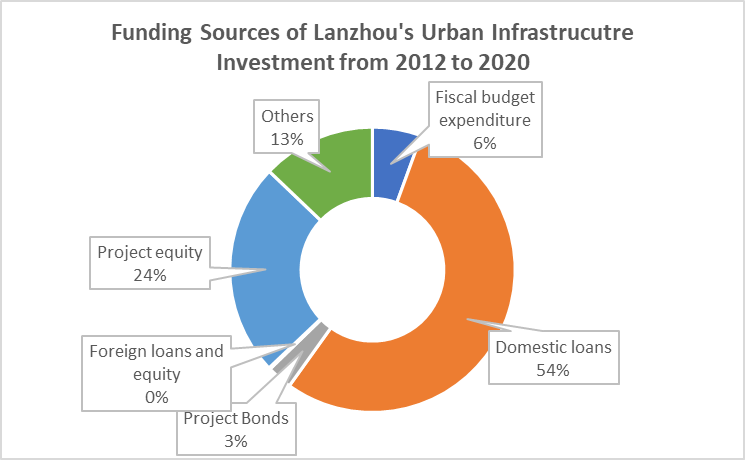
The FAI-UPI-FS data suggests that domestic loans are a major contributor to Lanzhou’s urban infrastructure investment. From 2012 to 2020, they provided RMB 93.96 billion to FAI-UPI, accounting for 54.3% [7]. Combining with project bond issuance, debt from the financial system made up of 57.2% of Lanzhou’s total urban infrastructure investment, compared with 5.6% from the fiscal budget expenditure.
Source: Wind database; author’s calculations.
Debt pressure mounting for City Construction Firms
China’s Fiscal Budget Law forbids local governments from obtaining loans from banks or other financial institutions. Therefore, infrastructure loans are shouldered by City Construction Firms (also known as Local Government Financing Vehicles). According to the FAI-UPI-FS data, the amount of loans/bonds is more than twice the amount of project equities for Lanzhou’s urban infrastructure investment, leading to high debt repayment pressure.
The mounting debt pressure is showcased by the Lanzhou City Construction Investment Co., Ltd. (LCCI), which is a major infrastructure project operator owned by the Lanzhou government. Its business fields cover urban infrastructure construction, sewage treatment, land development, and others. It also owns many subsidiaries that are in charge of utilities and other urban infrastructure services, such as Lanzhou Urban Infrastructure Construction Investment Co., Ltd., Lanzhou Thermal Power Corporation, Lanzhou Land Development Co., Ltd., and Lanzhou Public Transport Group Co., Ltd. It is also a major equity holder of a series of county-level city construction firms.
In 2012, when Lanzhou’s urban infrastructure began to leap forward, LCCI received a capital injection of RMB 10 billion (amounting to 60% of its end-of-2011 equity). Since then, LCCI expanded at an unprecedented speed. and the company’s scale was on the fast track. From 2012 to 2017, the LCCI’s total assets attained an annual growth rate of 23.0%, compared with 9.8% from 2009 to 2011. At the end of 2017, its total assets reached RMB 114.98 billion, more than tripling the amount in 2011.
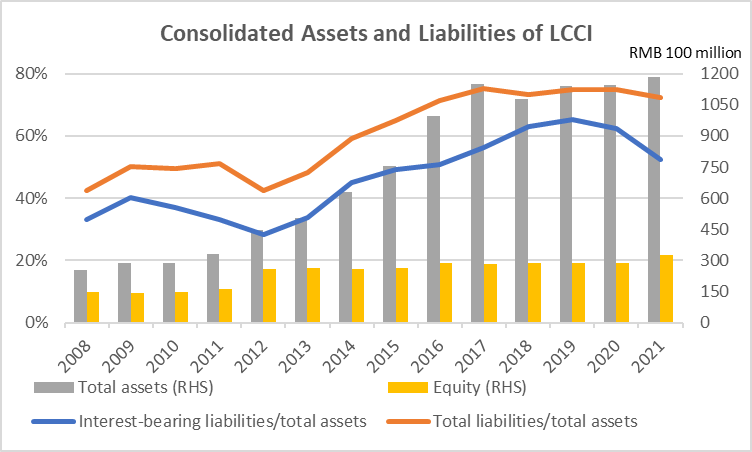
Sources: Wind database; author’s calculations.
This vast asset expansion was supported by debt accumulation. At the end of 2017, LCCI’s total liability reached 75% of its total assets from 30% in 2012. In other words, its leverage ratio increased from 0.4 to 3. Among total liabilities, those bearing interests totaled RMB 64.6 billion at the end of 2017, RMB 51.96 billion higher than that at the end of 2012, with the ratio of interest-bearing liabilities to total assets growing from 28% to 56%. [9]
However, this ultra-high-speed expansion stopped abruptly in 2018 when financial regulations tightened. Before then, loans to urban infrastructure projects mainly channels through the shadow banking system, consisting mainly of trust loans and entrusted loans, to circumvent banking regulations. Since 2018, the Chinese government started to crack down on shadow banking systems, and total outstanding trust/entrusted loans gradually shrunk, cutting out an important source of financing for city construction firms.
Against this background, LCCI’s total asset growth dropped to 0.7% per annual from 2018 to 2021, while the asset-liability ratio fell to 72% by the end of 2021. Meanwhile, interest-bearing liabilities fell from 67.91 billion yuan in 2018 to 61.89 billion yuan in 2021, reflecting LCCI’s constrained capacity in raising new debt.
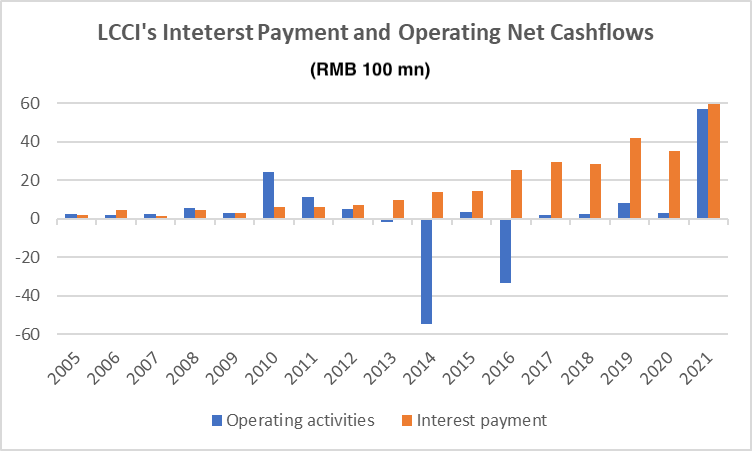
Urban infrastructure projects are usually associated with public welfare and therefore hard to charge high service fees. In many cases, cashflows generated from these projects cannot even cover operating expenses. In the case of LCCI, its operating net cashflows had been recorded as negative or positive but very close to zero from 2013 to 2020. Meanwhile, investment net cashflows stayed negative over the same period. This means debt payments are supported solely by cashflows from financing activities. [10]
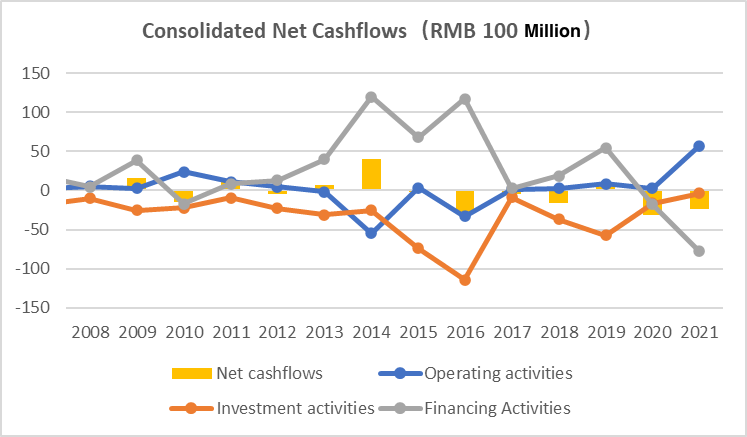
Source: Wind database; author’s calculations.
Even meeting interest payments prove to be difficult for LCCI. As city construction firms seldom pay dividends, “cashflows paid for the distribution of dividends, profits or repayment of interest” of the cashflow statement serves as a good proxy for their actual interest payments. Accompanying the accumulation of interest-bearing liabilities, LCCI’s interest payments steadily increased over the years, reaching RMB 5.97 billion in 2021. From 2013 to 2020, even in years when operating net cashflows were positive, interest payments amount to at least 500% of operating net cashflows. In 2016, the ratio was recorded at 1600%, setting a record. Although operating net cashflows increased significantly in 2021 (most likely due to the settling of receivables from the government), the amount was inadequate for interest payments.
Data sources: Wind database; author’s calculations.
In fact, LCCI has already been facing liquidity issues. In March 2022, the interest payment on a debt owed by “Lanzhou Plateau Summer Vegetables”, which was guaranteed by LCCI, was not delivered on time, but LCCI did not immediately fulfill its guarantee obligation due to liquidity issues. Although the debtor eventually made payment in June, it shocked investors’ confidence in LCCI. The yield of “19 LCCI PPN004”, a bond issued by LCCI maturing in August 2022, rose from 5.8% in January 2022 to 32.3% in mid-April [11], before falling to 22% by mid-June. LCCI now finds it hard to issue new bonds to refinance its debt.
Summary
Urban infrastructure improves residents’ livelihoods and is indispensable to a city’s development. However, the pace of infrastructure investment should be carefully paced to ensure financial sustainability, which, in the bottom line, requires operating cashflows to be able to cover interest payments. Given limited project cashflows collected from service fees, the debt of urban infrastructure projects is most likely paid back by fiscal subsidies, government service purchases, or the transfer of land ownership.
Therefore, a city’s future fiscal capacity should be carefully studied when planning urban infrastructure investment. Generally speaking, revenues and expenditures in the General Budget grow at a similar speed to that of the economy, which has been on a downward trend in recent years. Proceeds from the Government Funds are mainly associated with land selling, which used to grow at high speed in past years. However, in the future, land selling revenues are most likely to slow down for two reasons. On the one hand, with financing conditions tightened, land demand has been shrinking in less-developed cities. On the other, high-value-added land in the downtown area is almost sold out, and future sales would rely on lands in suburbs (which are cheap) or lands already developed (which are expensive to collect). In other words, it would be unwise to forecast the future land selling revenues by assuming high growth rates in the past.
Infrastructure is like taking medicine when sick: inadequate would not work, while overdose is dangerous. Urban infrastructure requires sustainable investment, but sudden and extreme expansion is mostly like to result in insolvencies.
Notes and References
[1] Provincial capitals (capital of the autonomous region) and other five major cities (Dalian, Qingdao, Ningbo, Shenzhen and Xiamen).
[2] Annual data of major cities, National Bureau of Statistics National Data Website https://data.stats.gov.cn/easyquery.htm?cn=E0105
[3] “The Visual Feast has been rescheduled! The Lighting Ceremony of the Yellow River Tower will be held on the evening of the 29th, and Lanzhou will be broadcast live”, Lanzhou Morning News, https://baijiahao.baidu.com/s?id=1679023291674566852\&wfr=spider\&for=pc
[4] This covers investment under the general public budget and government fund budget. The data is obtained from the Wind database and calculated by the author.
[5] Where are the trillions of land transfer funds going? More than half of it will be used for land acquisition and demolition compensation” http://house.people.com.cn/n/2015/0309/c164220-26659732.html
[6] For details, see “Statistical System of Urban Public Utilities of the Ministry of Housing and Urban-Rural Development”.
[7] The fixed investment in urban infrastructure under the caliber of “funding sources” is 172.93 billion yuan, slightly higher than the data under the caliber of “completed amount”.
[8] According to the shareholder information in the Wind database, the shareholders of Lanzhou City Investment are Lanzhou Construction Investment (Holding) Group Co., Ltd. (holding 97.1%, also known as Lanzhou Construction Investment) and China Development Development Fund Co., Ltd. (holding 2.9%) , while Lanzhou Jiantou is a wholly-owned subsidiary of Lanzhou Investment (Holding) Group Co., Ltd. Lanzhou Investment is wholly-owned by Lanzhou State-owned Assets Supervision and Administration Commission.
[9] Interest-bearing liabilities are the sum of short-term borrowings, non-current liabilities due within one year, short-term bonds payable, long-term borrowings, bonds payable, and long-term payables.
[10] From 2012 to 2021, the cash received by the company through investment absorption was only 670 million yuan.
[11] 21 Caijing, “More than 14 million yuan of interest is overdue, Lanzhou City Investment responded that “the funds raised will be returned immediately” https://m.21jingji.com/article/20220325/herald/8ebcfa5e6528d6035b4632f703e3c352.html