- How Much of Intra-BRICS Trade is Production-Oriented?
- How Much of the BRICS Countries’ Trade in Production Goods Comes from Other BRICS Countries?
- China’s Capital Goods: A Major Bolster of the Intra-BRICS Production Goods Trade
Note: This is an original piece by David Marx. Please cite according to Creative Commons 4.0 when sharing
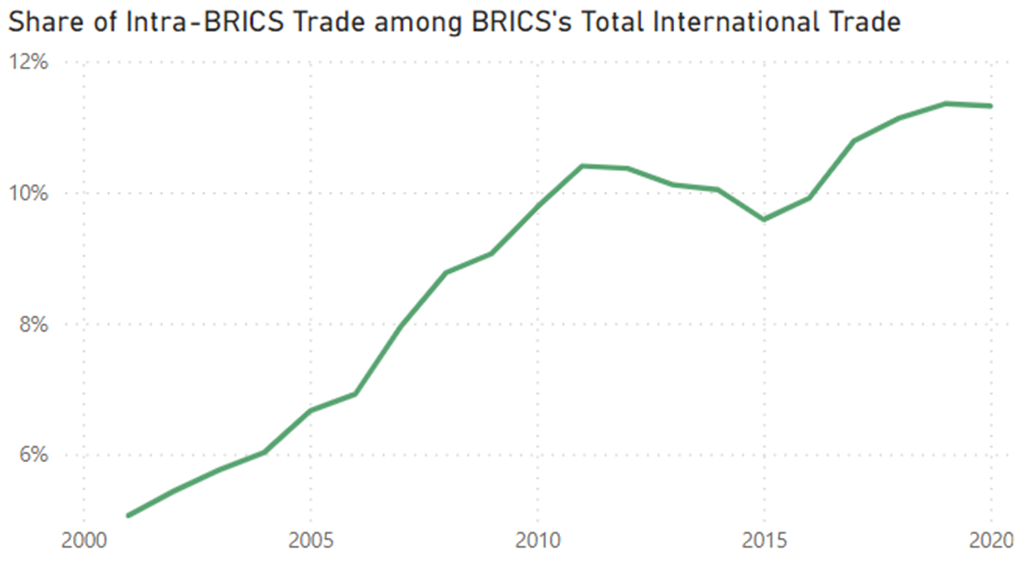
Since the first BRICS Leaders’ Summit in 2009, trade among the BRICS countries has been flourishing. In 2021, the total goods trade among the five countries exceeded $500 billion for the first time, more than 2.2 times the level in 2010. By 2020, the trade volume among the BRICS countries accounted for 11.3% of their total global trade, an increase of 1.5 percentage points from 2010 and 6.2 percentage points from 2001.
More importantly, with the industrial upgrading of the BRICS countries, the complementarity of industrial cooperation among them has been continuously enhanced. Brazil’s agricultural products, iron ore, and copper ore, Russia’s oil and natural gas, India’s chemicals and pharmaceutical products, China’s steel, cement, and machine tools, as well as South Africa’s rare metals, cover almost all the intermediate goods and capital goods required for industrial and manufacturing production.
At the same time, the BRICS countries have also made notable achievements in industrial technology, such as Brazil’s bioenergy, Russia’s civilian nuclear power, India’s oil refining, China’s photovoltaics and new energy vehicles, and South Africa’s mining industry.
The combination of these industrial technologies, capital goods, and intermediate goods will bring about vast potential for industrial cooperation among the BRICS countries. For example, when Brazil is building iron ore factories, it may import China’s mining equipment and heavy-load vehicles, and then exports the iron ore to China for steel production, which is then exported to other countries.
Another example is that Brazil’s copper and South Africa’s gold can be exported to China, processed into precision machine tools, and then exported to Russia for the manufacturing of nuclear-powered icebreakers, facilitating the opening of the Arctic shipping route.
Moreover, South Africa and Russia’s rare metals, and China’s circuit control chips can be exported to Brazil, where they are used in BYD’s factories to produce new energy vehicles for export to other Latin American countries.
Such production-oriented cooperation will not only inject momentum into the industrialization and industrial upgrading of each BRICS country but also strengthen the foundation for their economic and political cooperation.
Has the potential of such industrial chain cooperation already begun to be unleashed? This article will answer this question by analyzing the macroeconomic trade data of the BRICS countries over the past 20 years.
The three main conclusions are as follows:
First, from 2001 to 2020, trade among the BRICS countries is heavily leaning towards production, compared with consumption, as evidenced by the high proportion of trade in capital goods and intermediate goods.
Second, within the production goods, the trade in capital goods among the BRICS countries has been booming, indicating that, with the industrial upgrading, the trade structure among the BRICS countries has undergone profound changes, and the BRICS countries have already laid the initial foundation for forming a closed loop of industrial production from raw materials, energy, intermediate goods, machinetools, design and innovation to final products. This will provide a solid basis for their future monetary and financial cooperation.
Third, China has become an important source of capital goods imports for the other BRICS countries.
How Much of Intra-BRICS Trade is Production-Oriented?
The most direct indicator of the production-oriented nature of intra-BRICS countries is how much of their trade is in production goods. Such trade is not for final consumption but for participation in subsequent production processes. The international trade of production goods is an important form of supply chain cooperation. The higher the proportion of production goods in trade (the lower the proportion of consumer goods), the more trade is oriented towards production.
The definition of production goods is often based on the System of National Accounts (SNA). Among different trade product classifications, the United Nations Broad Economic Categories (BEC) has a relatively clear conversion relationship with the SNA.
According to the official manual, the BEC trade product categories can be divided into capital goods (machine tools, engineering machinery, etc.), intermediate goods (industrial agricultural products, crude oil, parts and components, steel, cement, etc.), consumer goods, and others. The “others” category mainly includes products that can be used for both consumption and production, such as gasoline.
Based on the trade data of the BRICS countries by BEC product and trading partner from the UN Comtrade database, the proportion of production goods in intra-BRICS trade can be calculated.
From 2001 to 2020, intra-BRICS trade of production goods (including both intermediate and capital goods) as a share of total intra-BRICS trade (the dark blue line in the figure below) has risen from 74% to 85.4%. Except for the period of the global financial crisis and the European debt crisis from 2009 to 2013, this ratio has been on an upward trend.
For comparison, BRICS countries’ trade of production goods as a share of BRICS countries’ total international trade (the light blue line) has only risen from 74.7% in 2001 to 78.3% in 2020, which has almost stagnated since 2005.
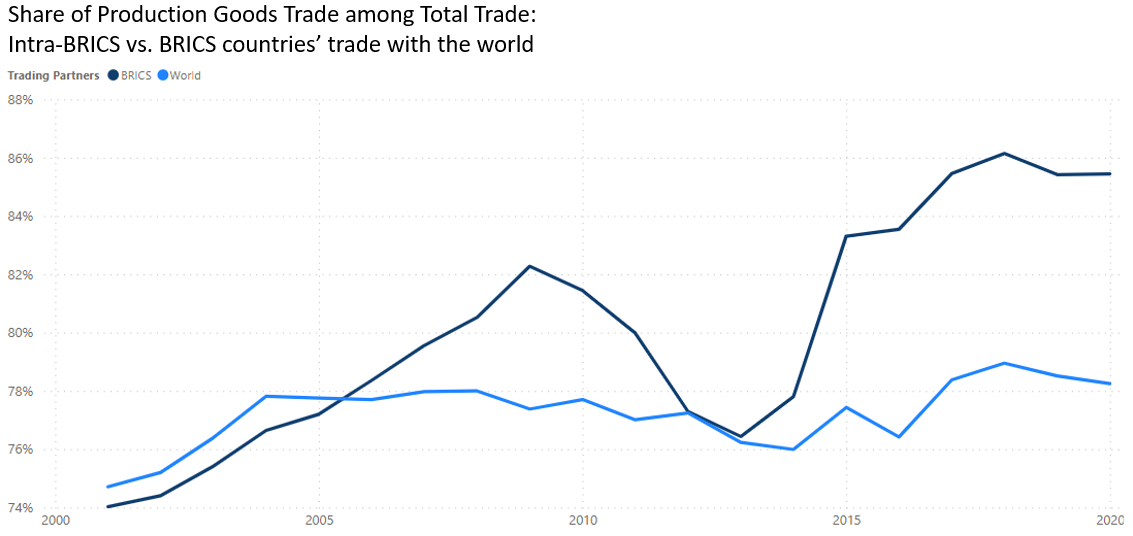
The above calculations show that, at the beginning of this century, the trade among the BRICS countries did not exhibit a particularly pronounced production-oriented characteristic compared to the BRICS countries’ trade with non-BRICS countries. However, by 2020, the trade among the BRICS countries has clearly shown a concentration towards production, with the dark blue line growing above the light line with a rising gap.
How Much of the BRICS Countries’ Trade in Production Goods Comes from Other BRICS Countries?
The above calculations show that the goods trade among the BRICS countries exhibits a clear production-oriented trend. A reflective question is how much of the BRICS countries’ trade in production goods comes from other BRICS countries.
In 2020, 12.4% of BRICS countries’ production goods trade is conducted with other BRICS countries, compared with only 5.0% in 2001. In other words, this ratio has more than doubled in 20 years.
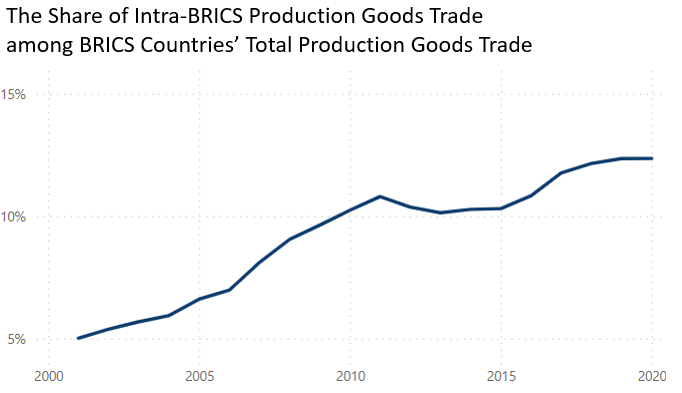
For comparison, only 11.3% of the BRICS countries’ total trade in 2020 was conducted with other BRICS countries (up from 5.1% in 2000). This means, compared to the consumer goods sector, the BRICS countries now have a higher degree of trade dependence upon other BRICS countries in the production goods sector.
The above aggregated calculation may be biased since BRICS are different in economic size, per capita income, and industrial structure, and therefore their dependence on production goods from other BRICS countries may also vary. For each BRICS country, how much of their production goods trade is conducted with other BRICS countries? This ratio could be regarded as “BRICS production goods dependency indicator”.
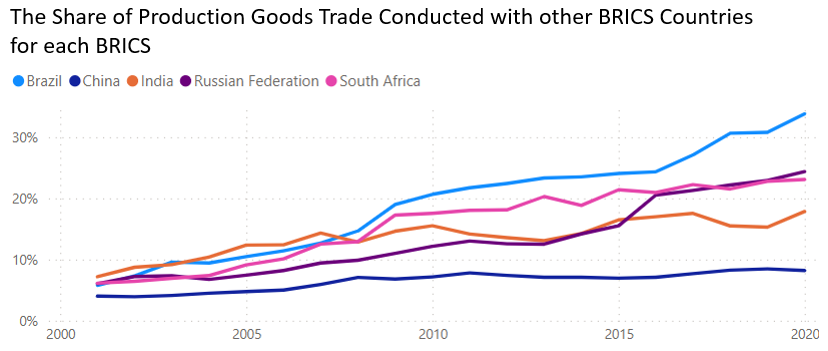
Calculations show that China has the lowest production of goods dependent on BRICS, with its share of production goods trade conducted with other BRICS countries rising slowly from 4.0% in 2001 to 8.2% in 2020.
Among the other BRICS countries, Brazil has the highest dependence. In 2001, only 5.8% of its production goods trade are conducted with other BRICS, while in 2020, the ratio jumped to 33.8%.
Russia and South Africa’s dependence was recorded at 24.4% and 23.1% in 2020, respectively (an increase of 18.3 and 17.0 percentage points compared with the level in 2001, respectively).
India has the lowest dependence in 2020 at 17.9%, up from 7.2% in 2001.
For the BRIS countries (excluding China from BRICS), 24% of their production goods trade is conducted with BRICS countries, up from 6.2% in 2001.
China’s Capital Goods: A Major Bolster of the Intra-BRICS Production Goods Trade
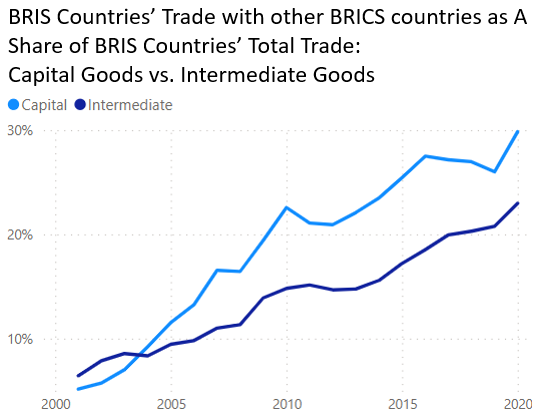
Which product, capital goods or intermediate goods, is providing a greater impetus for the rise of trade dependence among the BRICS countries’ production goods trade? Given that China is an outlier in terms of BRICS dependence, the calculations below focus on the BRIS (Brazil, Russia, India, and South Africa) to address this question.
For the BRIS, in 2020, 29.9% of their capital goods trade is conducted with BRICS, up from 5.2% in 2001 (the light blue line), whereas, for intermediate goods, the ratio increased from 6.4% in 2001 to 23.0% in 2020 (the dark blue line).
In other words, at the beginning of this century, the BRIS countries had a higher BRICS dependence in terms of intermediate goods trade compared with capital goods, but by 2020, the relationship has been reversed, represented by the upward-crossing of the light blue line against the dark blue line.
The rise of intra-BRICS capital goods trade deserves special attention. Aside from consumption goods, trade among emerging economies is traditionally dominated by intermediate goods, because this is what a developing country can produce relatively cheaply building on their natural endowment.
For example, with reserves of iron ore, copper ore, oil, and natural gas, it is not difficult to engage in the mining sector. With minimal industrial development, a resource-endowed economy can start exporting raw ores and crude oil. With further efforts in industrial upgrading, it may export iron and copper products or petrochemical products to secure a more favorable position in the global value chain.
In contrast, capital goods such as machine tools, construction machinery, and heavy-load trucks often require higher R\&D investment and experience accumulation in design and engineering. Traditionally, those are trophies reserved for developed countries. Therefore, even if one emerging economy decides to invest in another emerging economy for a greenfield industrial project, the two would have to purchase capital goods from a developed country, such as Germany and Japan.
However, with China gradually climbing up the value chains in the past 20 years, the landscape of global capital goods markets has been shifting. Building upon its huge domestic market, industrial experience accumulated in the “self-sufficient period” before the Reform and Opening Up, active learning when engaging with multinational firms since the 1980s, and continuous R\&D investment, China has made significant progress in areas such as machine tools, construction machinery, and automobiles. Although it may not be able to produce the most high-end products, in many areas, Chinese firms have already acquired the capacity to compete with western peers in terms of product quality and price.
Taking engineering machinery as an example, as discussed in “Construction Machinery Exports, Developing Economies’ Markets, and the Internationalization of RMB,” in 2002, the top five exporters of construction machinery”, in 2002, the top five exporters of construction marchinery were Japan, Germany, the US, the UK, and France with a share of 59.9%. However, by 2022, China has become the world’s largest exporter of engineering machinery, with a global export share of 20%.
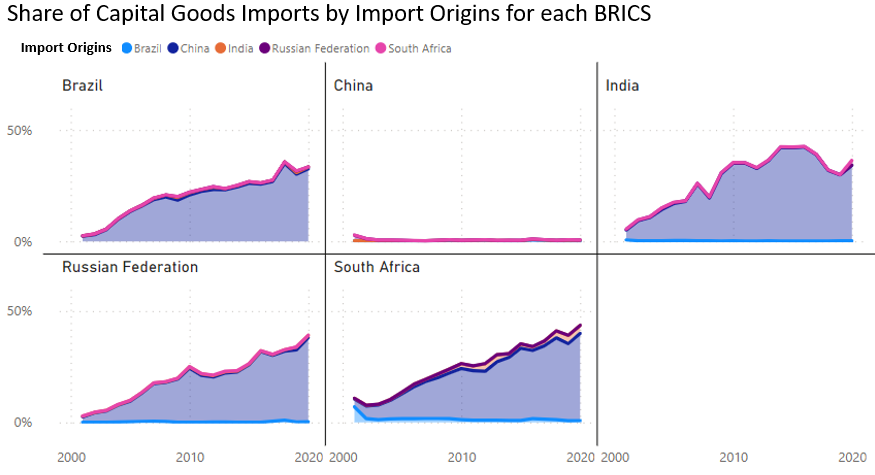
China’s rising presence in the global capital goods market is ostensibly reflected in intra-BRICS trade. In 2020, over a third of BRIS countries’ capital goods imports came from China, while, for China, capital goods imported from other BRICS made merely only 0.6%.
- For South Africa, among its capital goods imported in 2020, those from China made up 39.1% (35.7 percentage points higher than in 2001), compared with 0.93% from Brazil, 0.03% from Russia, and 3.61% from India.
- For Russia, China’s share reached 37.9% in 2020 (an increase of 35.5 percentage points compared with that in 2001), compared with 0.31% of Brazil, 0.97% of India, and 0.06% of South Africa.
- For Brazil, China accounted for 32.6% of its total capital goods imports in 2020 (up by 30.3% compared with that in 2001), while Russia, India, and South Africa accounted for 0.01%, 0.78%, and 0.04% respectively.
- For India, China accounted for 33.9% of its total capital goods imports in 2020 (up by 35.7% compared with that in 2001), whereas Brazil, Russia, and South Africa accounted for 0.21%, 0.21%, and 2.06% respectively.
With the rise of capital goods trade among the BRICS countries, which embeds technology and R\&D capabilities, the BRICS countries can rely solely on each other to cultivate fresh industrial capacities in many fields. In other words, being able to source capital goods from intra-BRICS trade closes the loop for BRICS industrial cooperation. This provides a solid foundation for BRICS cooperation not only in manufacturing and trade but also in monetary and financial areas.