Disclaimer: This personal research note may contain errors and is provided for reference only.
- Note: This article is generated by Monica Agent (monica.im) based on this report deck*
This note reviews the state of the global economy as of mid-July 2026, five months after Iran and the United States/Israel entered open military conflict. It examines how the conflict has affected global growth, energy prices, inflation, monetary policy, sovereign bond markets, and equity markets, and concludes with a discussion of the key risks that could disrupt the current fragile equilibrium.
1) Overview: A World Economy That Has Held — For Now
The global economy has demonstrated notable resilience in the five months since the outbreak of hostilities in the Middle East. Following a brief truce in June, new rounds of crossfire have made clear that a clean end to the conflict is unlikely in the near term. Yet the macroeconomic damage, at least so far, has been more contained than many feared.
The IMF’s July 2026 World Economic Outlook Update projects global GDP growth of 3.0% for 2026 — only 0.3 percentage points below the pre-war January forecast of 3.3%. Combining the revisions for 2026 and 2027, the cumulative loss in global output expansion amounts to roughly 0.4% of 2025 global real GDP. This outcome is considerably better than the Adverse Scenario the IMF sketched in April, which assumed a more severe escalation of hostilities. The milder-than-feared military trajectory, the drawdown of strategic oil reserves, and the continued boom in AI-related investment and trade all contributed to the better-than-expected outcome.
That said, the current environment is best described as resilient but stretched. Brent crude is trading above USD 80 per barrel, inflation in major advanced economies (AEs) remains above the 2% policy target, the US Federal Reserve is holding rates at 3.5%–3.75% with a bias toward further tightening, and long-term sovereign bond yields remain elevated. In this context, any one of several plausible shocks — a further escalation of the conflict, renewed trade restrictions, a deceleration in AI investment, or a correction in technology firm valuations — could break the fragile balance.
2) Global Growth: Heterogeneous Impact Across Economies
The aggregate resilience of global growth masks a significant divergence in outcomes across country groups.
Growth forecasts for advanced economies have seen little revision relative to the pre-war baseline. These economies benefit from more diversified energy supply chains, deeper financial markets, and greater capacity to absorb commodity price shocks through fiscal and monetary buffers. By contrast, forecasts for emerging market and developing countries (EMDCs) have been revised down substantially, particularly for oil-importing economies that are not deeply integrated into AI-related supply chains and therefore cannot offset the energy cost shock with technology-sector tailwinds.
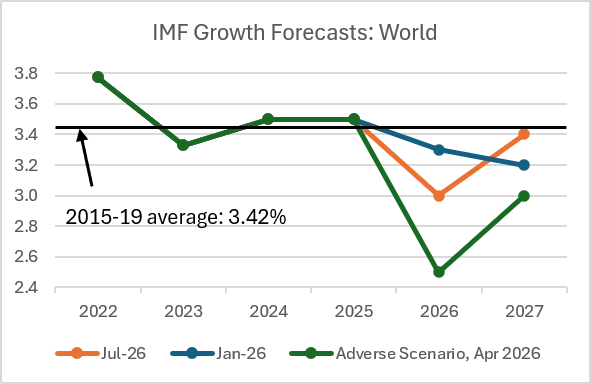
Figure 1. IMF growth forecasts for the world economy under the July 2026 baseline, the pre-war January 2026 baseline, and the April 2026 Adverse Scenario. The horizontal line marks the 2015–19 pre-pandemic average of 3.42%.
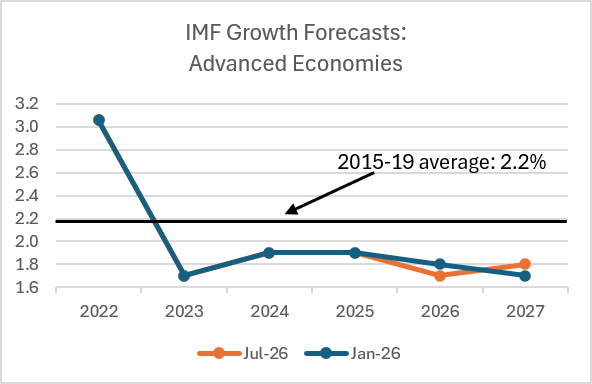
Figure 2. IMF growth forecasts for advanced economies. The horizontal line marks the 2015–19 pre-pandemic average of 2.2%.
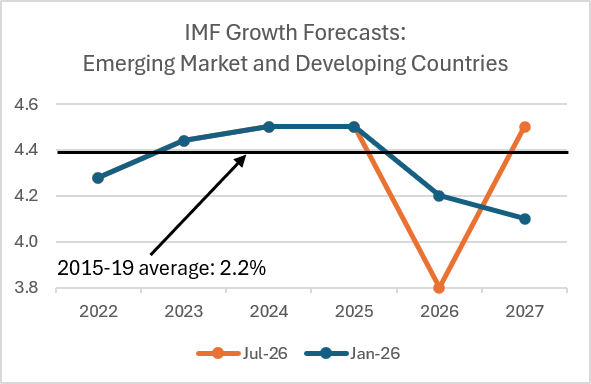
Figure 3. IMF growth forecasts for emerging market and developing countries. The horizontal line marks the 2015–19 pre-pandemic average of 2.2%.
One structural concern that transcends the conflict is that global growth in 2026–27 will continue to fall short of the pre-pandemic average of 3.4% (2015–19). The Middle East conflict has added a cyclical headwind to what is already a structurally subdued growth environment.
3) Energy Prices: A Second Spike Following the End of the Truce
Energy markets have been the most direct transmission channel from the conflict to the real economy. The initial price spike in March and April 2026 was considerably milder than the surge that followed Russia’s invasion of Ukraine in 2022. Prices had eased substantially in late June following the signing of a Memorandum of Understanding between the US and Iran.
However, the renewal of attacks and the announced closure of the Strait of Hormuz reversed those gains swiftly. By mid-July, Brent crude had climbed back above USD 80 per barrel, while the NBP natural gas price had erased all of the ceasefire-related declines.
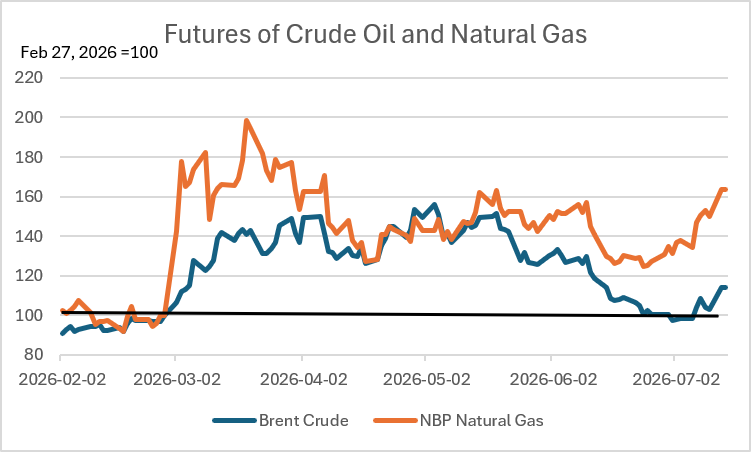
Figure 4. Indexed futures prices of Brent crude oil and NBP natural gas, rebased to 100 as of February 27, 2026.
The divergence between crude and refined product prices is a notable feature of the current episode. London gasoline futures are now approximately 50% above the pre-war level, a larger increase than that seen in crude oil itself. This reflects not only the direct impact of the Middle East conflict but also ongoing tensions in Eastern Europe, which have constrained European refining capacity.
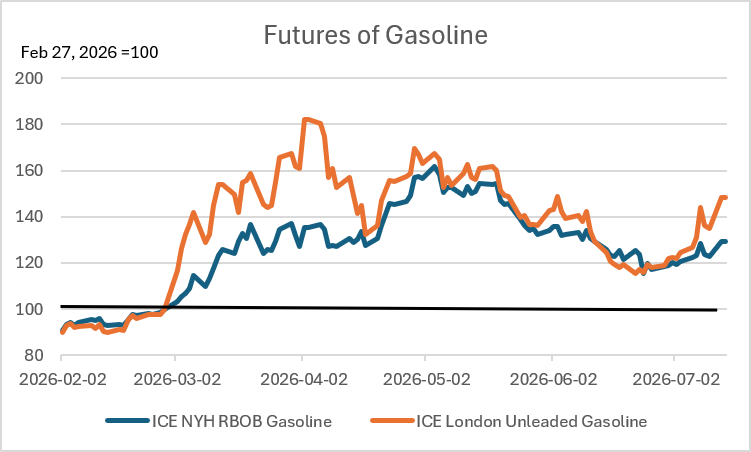
Figure 5. Indexed futures prices of ICE NYH RBOB Gasoline and ICE London Unleaded Gasoline, rebased to 100 as of February 27, 2026.
Fertilizer prices, which are key derivatives of oil refinery outputs, also saw a sharp elevation in Q2, with only modest pullbacks during the ceasefire period. The Diammonium Phosphate (DAP) price is currently as elevated as it was in mid-2022, raising concerns about food production costs in the coming agricultural seasons.
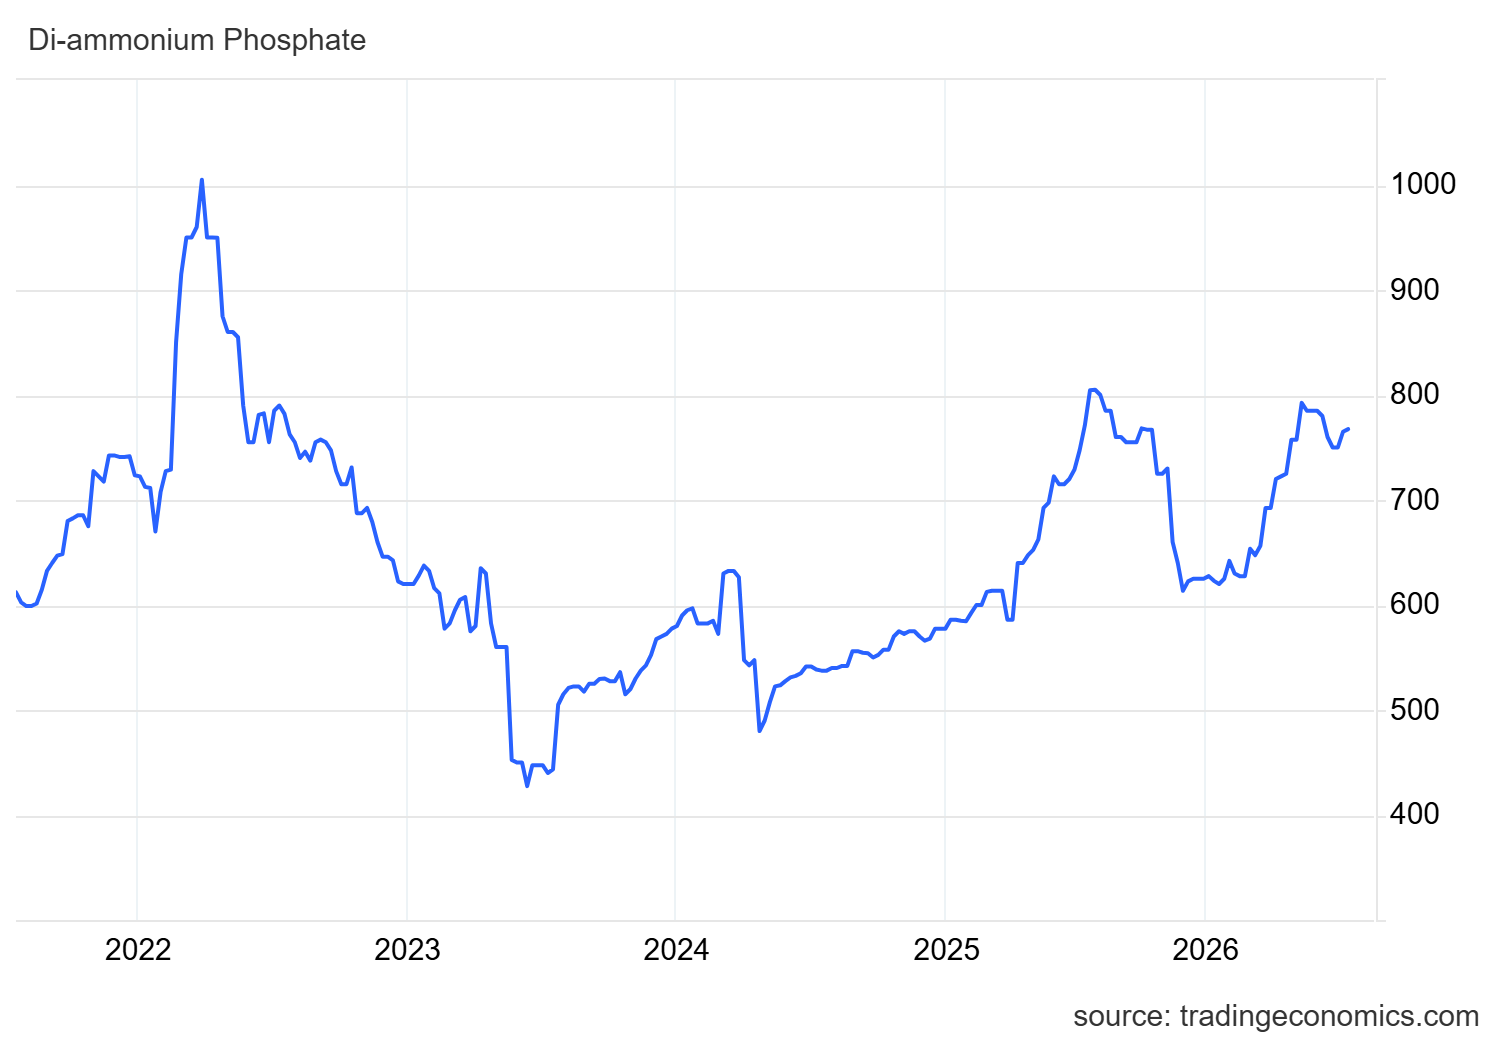
Figure 6. Di-ammonium Phosphate (DAP) spot price. Source: tradingeconomics.com.
4) Inflation: Rising but Still Short of the 2022 Peak
Higher energy prices have pushed headline inflation meaningfully above the 2% policy targets in major advanced economies. In the United States, headline CPI inflation rose from 2.4% year-on-year in February to 4.2% year-on-year in May. In the Euro Area, the corresponding increase was from 1.9% to 3.1%. Inflation in Japan rose less dramatically, in part because of government energy subsidies that buffered the pass-through from global commodity prices to domestic consumer prices.
Inflation eased somewhat in June following the ceasefire, but the renewed conflict is likely to impede the disinflation process in the months ahead.
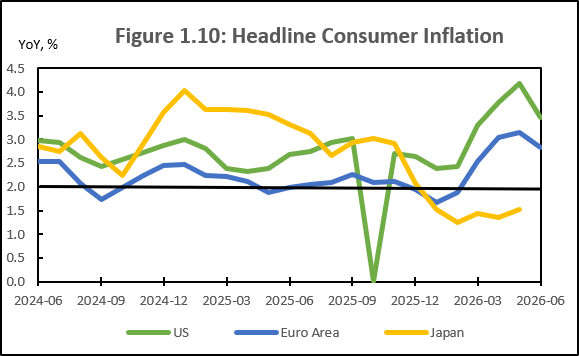
Figure 7. Headline consumer price inflation (year-on-year, %) for the US, Euro Area, and Japan.
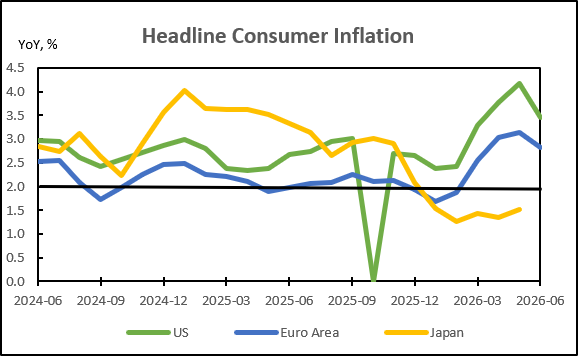
Figure 8. Headline consumer price inflation (year-on-year, %) for the US, Euro Area, and Japan — extended historical view.
Compared with the 2022 inflation surge, which pushed annual headline inflation to approximately 7% across advanced economies at its peak, the current acceleration remains moderate. Nonetheless, central banks in major AEs now project inflation to remain above the 2% target through 2026 and into 2027.
| Headline Inflation Projections | 2026 | 2027 |
|---|---|---|
| US Fed — Jun 2026 | 3.6% (+0.9 ppts) | 2.3% (+0.1 ppts) |
| ECB — Jun 2026 | 3.0% (+0.4 ppts) | 2.9% (+0.3 ppts) |
| BOJ — Apr 2026 | 2.8% (+0.9 ppts) | 2.3% (+0.3 ppts) |
Note: Figures in parentheses indicate the change in percentage points relative to the previous forecast round. BOJ forecasts refer to CPI of all items less fresh food.
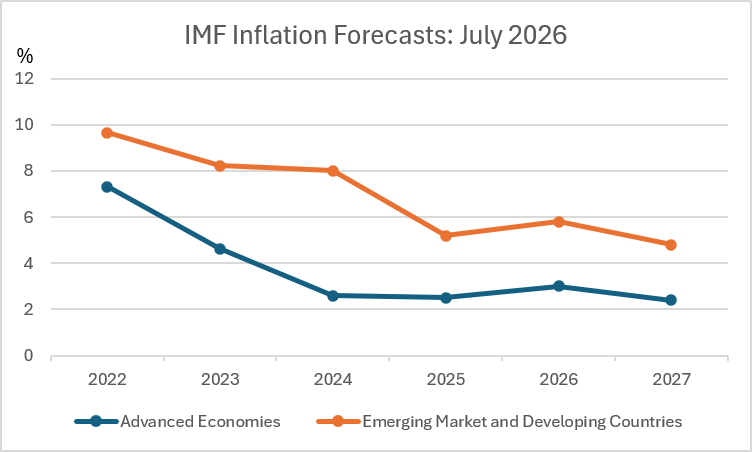
Figure 9. IMF inflation forecasts for advanced economies and emerging market and developing countries, July 2026.
5) Monetary Policy: Alert but Not Aggressive
Central banks in major advanced economies have responded to the renewed inflation pressure with caution, tightening modestly while signalling restraint against a more aggressive policy response.
In June, both the European Central Bank (ECB) and the Bank of Japan (BOJ) raised their policy rates by 25 basis points. ECB President Lagarde characterised the hike as a “robust move across all scenarios” and indicated that she saw no evidence warranting a more forceful response at the current juncture. A majority of BOJ rate-setters cited continued upside risks to energy inflation as the basis for supporting the further rise in the policy rate.
The US Federal Reserve held its policy rate unchanged at 3.5%–3.75% at the June meeting. Fed Chair Kevin Wash emphasised that the FOMC’s commitment to achieving the 2% inflation target was “strong, unanimous, and unambiguous.” Notably, all forward guidance was removed from the FOMC statement, and Chair Wash did not submit his own economic projections — an unusual signal of heightened uncertainty. The median projection of FOMC participants implies a 25 basis point hike in the Federal Funds rate by end-2026, while market participants, as of July 14, assign a 79.3% probability to at least one hike between July and December 2026.
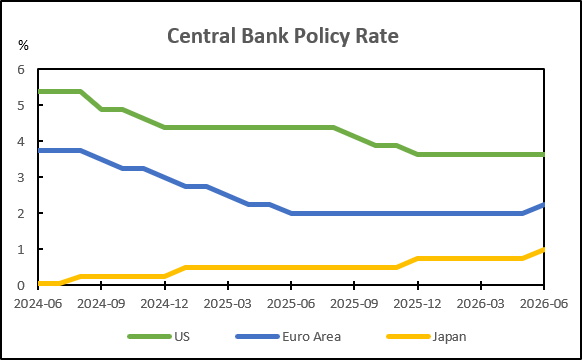
Figure 10. Policy rates of the US Federal Reserve, European Central Bank, and Bank of Japan.
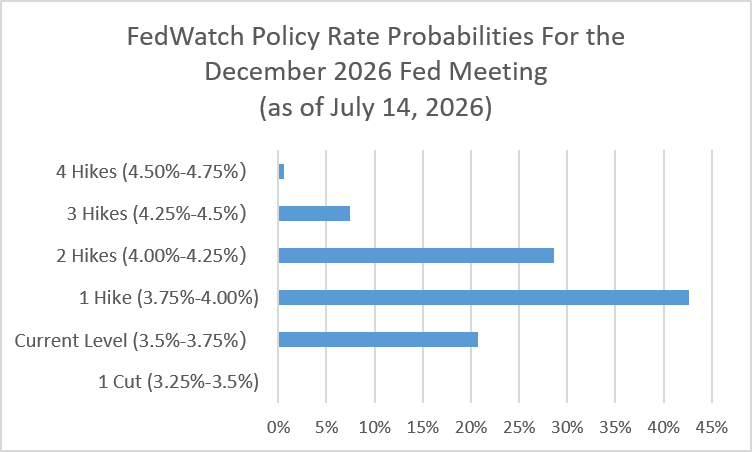
Figure 11. CME FedWatch probability distribution for the Federal Funds rate target range at the December 2026 FOMC meeting, as of July 14, 2026.
6) Sovereign Bond Markets: Yields Remain Elevated
Long-term sovereign bond yields in major advanced economies have trended upward since the onset of the Middle East conflict, reflecting a combination of inflation concerns, tighter monetary policy expectations, and diminishing fiscal space.
In broad terms, yields rose in March and April, peaked around mid-May, partially retreated thereafter, and have since resumed their upward trajectory following the end of the military truce.
For the United States, the 30-year Treasury yield touched 5.12% in early May — the highest level since mid-2007 — and has remained above the psychologically significant 5.0% threshold since July 7. The 10-year yield has been fluctuating around 4.5%, the upper end of its post-pandemic trading range.
For Japan, the 30-year JGB yield set a new record of 4.09% in May, while the 10-year yield reached a new high of 2.85%. Market participants are increasingly concerned that the Bank of Japan may be behind the curve in containing inflation, and that further depreciation of the Japanese yen could compound the problem.
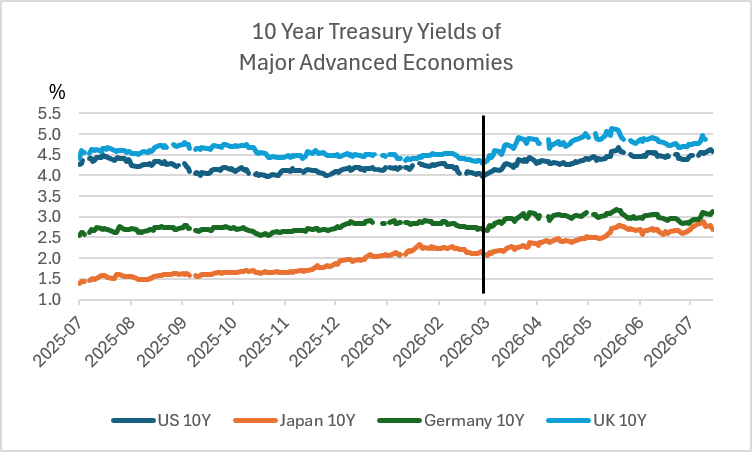
Figure 12. 10-year sovereign bond yields for the US, Japan, Germany, and the UK. The vertical line marks the onset of the Middle East conflict.
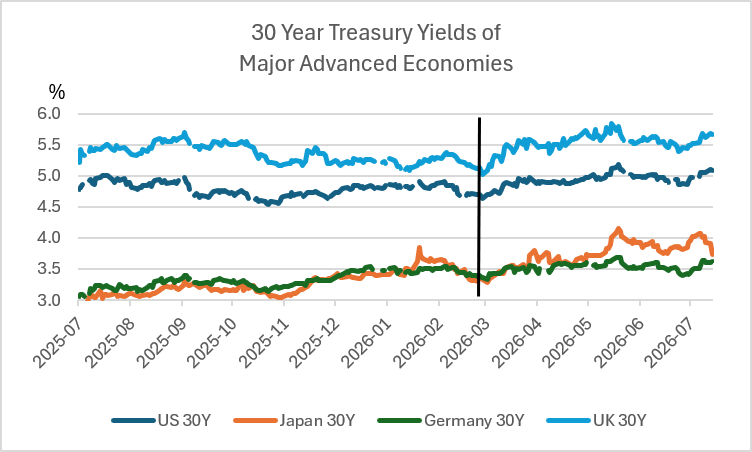
Figure 13. 30-year sovereign bond yields for the US, Japan, Germany, and the UK. The vertical line marks the onset of the Middle East conflict.
7) Equity Markets: Sideways, with Semiconductor Stocks Rolling Over
Benchmark equity indices in major advanced economies have broadly moved sideways since mid-May, following a sharp dip in March and a strong recovery in April–May.
US equity markets have been the most resilient. By mid-July, the S&P 500 was approximately 10% above its pre-war level, while the NASDAQ was roughly 15% higher. The primary driver of the April–May recovery was the surge in semiconductor stocks, which benefited from continued strong demand for AI-related hardware. However, the Philadelphia Semiconductor Index has since rolled over, declining approximately 20% from its mid-June peak, suggesting that some of the AI-driven optimism may be fading at the margin.
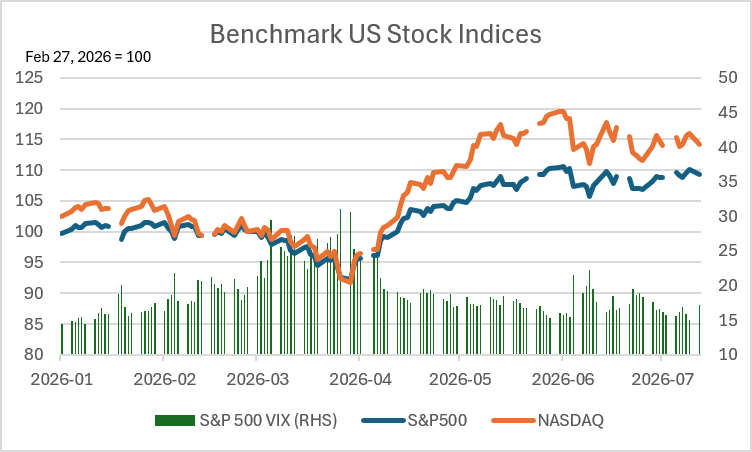
Figure 14. S&P 500, NASDAQ, and S&P 500 VIX (right axis), rebased to 100 as of February 27, 2026.
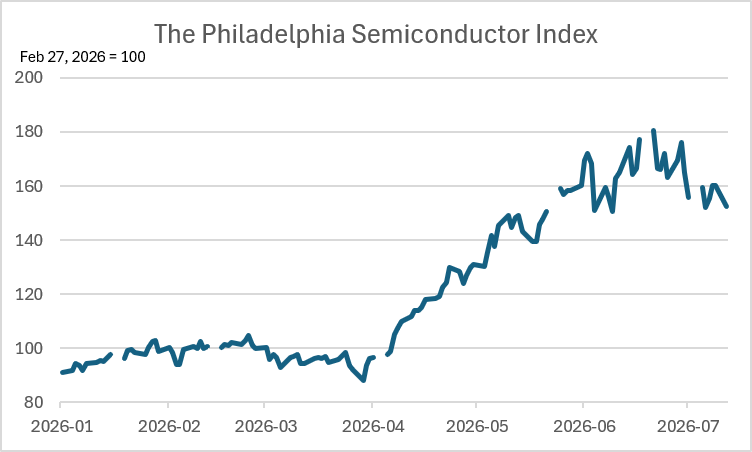
Figure 15. The Philadelphia Semiconductor Index, rebased to 100 as of February 27, 2026.
Outside the US, the picture is more mixed. The Japanese Nikkei 225 followed a trajectory similar to US semiconductor stocks, rolling over in late June and early July. Europe’s Stoxx 600 saw a much more modest recovery and has barely surpassed its pre-war level. Meanwhile, tightening expectations for the US Fed have supported the US Dollar Index, which was recorded at around 101 in mid-July. The Japanese yen has continued to depreciate against the US dollar, adding to the BOJ’s policy dilemma.
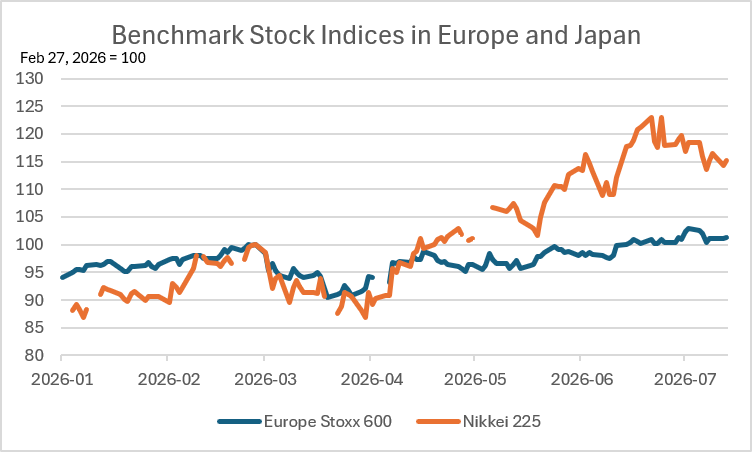
Figure 16. Europe Stoxx 600 and Nikkei 225, rebased to 100 as of February 27, 2026.
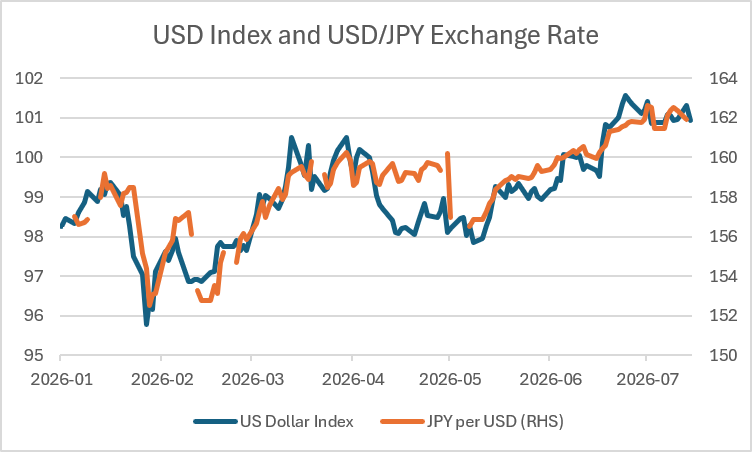
Figure 17. US Dollar Index (left axis) and JPY per USD exchange rate (right axis).
8) Outlook: Three Questions for a “Not Too Bad, But Not Good” World
The baseline scenario going forward is one of continued resilience without resolution. Growth will likely remain below the pre-pandemic average; inflation will likely stay above policy targets; Brent crude will likely remain above USD 80; the Federal Funds rate will likely stay at 3.5%–3.75% for another six to twelve months; and the US 10-year Treasury yield will likely hover around 4.5%. This is not a catastrophic outcome, but it is far from a comfortable one.
Three questions are worth contemplating in this “not too bad, but not so good” context:
On energy and food security: Even if the Iran–US conflict avoids serious escalation, will the ongoing drawdown of crude oil and natural gas reserves further push up prices for refined petroleum products — such as gasoline, fertilizers, and plastics — whose supply chains are more constrained than those of crude oil itself?
On sovereign and corporate debt: Even if the US Fed and the ECB opt to hold policy rates at current levels rather than tighten further, will long-term Treasury yields at their current elevated levels translate into serious financial burdens for governments and enterprises that need to refinance the cheap debt they raised during the pandemic era of near-zero interest rates?
On AI investment and technology valuations: Even if AI investment continues at its current pace, will technology firm valuations remain elevated when input costs (chips, memory, PCBs, and other components) continue to rise, while non-technology enterprises — the paying customers of AI applications and models — are constraining or cutting IT expenditures in response to stalling consumption and weak non-technology investment?
The answers to these questions will determine whether the current fragile balance holds or breaks in the months ahead.
