-
Introduction
-
Adequate project income coverage for LG-PBs’ repayment
-
Implicit Debt embedded in PIEs’ Equity Contribution May Impair Financial Sustainability
-
Extending the Operating Period or Rolling over Debt Cannot Solve All the Problems
-
Summary
Note: This is an original piece by David Marx. Please cite according to Creative Commons 4.0 when sharing
Click here to download the PDF version
China’s Local Government Project Bonds: Hidden Debt Behind Project Equity May Impair Financing Sustainability
Introduction
The 2014 Fiscal Reform requested that local governments in China can only borrow through public bond issuance, which out-lawed direct bank loans, indirect corporate borrowing on behalf of government agencies, and shadow banking borrowings. Since then, the central government dedicated many efforts in ensuring the transparency and sustainability of local government debt financing.
One of those measures is to categorize local government debt into Project Bonds (LG-PBs) and General Bonds (LG-GBs), with the former financing projects that can generate stable cash flows to cover the principal and interests of bonds, alleviating future fiscal burden. As of the end of June 2022, the balance of LG-PBs totaled RMB 20.3 trillion, 40% higher than that of LG-GBs, which are to be solely repaid by future fiscal income. [1]
The fiscal sustainability of LG-PBs depends on the quality of underlying projects. How are these projects financed? What are the sources of revenues? Are their cashflows adequate to repay debt principals and issuance? These are examined in the paper relying on the Project Introductory Documents (PIDs) attached in the 12th LG-PB issued by a Southwestern Province (CQ) in 2022, which finances 34 projects by the amount of RMB 18.9 billion;
The conclusions are as follows:
First, the project income is sufficient to repay the LG-PBs’ principal and interest under the assumptions made in the PIDs, with an average income-to-repayment coverage of 1.3. This is made possible by
-
First, LG-PBs only cover part of projects’ total investment: on average, the LG-PBs finance about 30% of the total project investment, with the remaining funds provided by the Project Implementing Entities (PIEs) in the form of project equity contribution.
-
Second, projects operate for sufficient long periods, usually 20 to 30 years.
Second, projects’ financial sustainability depends on whether the PIEs’ equity contribution is raised through debt.
-
Most of PIEs are local government State-Owned-Enterprises (usually called city construction firms, or Chengtou), many of which are solely owned by local governments. Usually, a Chengtou firm’s interest-bearing debt amounts to at least 40% of total assets.
-
Assuming 40% of a PIE’s equity contribution are raised through debts (with an interest rate of 4.7%, corresponding to China’s 5-Year Loan Prime Rate), then most projects will not generate adequate income to repay the associated principals and interests.
-
Extending the operating period or rolling over the debt principals can help some, but not all, projects to achieve financing sustainability.;
Third, building on the previous two points, it is proposed that project financial sustainability analysis should cover both direct and indirect debt burden.
- Currently, the financing sustainability focus on only the explicit project borrowings (LG-PBs). However, as PIEs are usually Chengtou firms with weak profits, implicit borrowings hidden in their equity contribution may well impair project sustainability. Therefore, both should be considered in structuring and preparing projects.
1. Adequate project income coverage for LG-PBs’ repayment
According to the PIDs, project income is categorized into “dedicated project revenues” and “revenues from Government Funds Expenditure” (Figure 1). The former includes land sales, as well as proceeds from operating parking lots, leasing apartments, offices, or factories, renting advertising space on road banners and streetlamps, selling tickets for theme parks. Revenues from Government Funds Expenditure mainly refers to government subsidies, which are all zero for 34 projects discussed in this paper.

Figure 1 Project income classification for LG-PBs
Source: Author’s analysis based on Project Introductory Documents.
Calculations show that, under the assumptions in the PIDs, project income (net income, taking out operating and maintenance costs, taxes, etc.) is adequate to cover LG-PB’s principal and interest expenses. Among the 34 projects, the income-to-repayment coverage ranges between 1 and 2.3, with a median of 1.3, with most projects fell in the range between 1.2 and 1.4 (Left Panel, Figure 2).

Figure 2 Boxplots for the coverage ratio of project income to LG-PB’s principal and interest payment (left) and the share of land sales income in total project income (right)
Source: Author’s calculation based on Project Introductory Documents.
Many regards land sales as the sole contributor of project income, but this is not the case for the 34 projects analyzed.16 of the 34 projects rely on zero income from land sales, while the rest 18 designated specific land zones whose sales revenues will be channeled to fulfill LG-PBs liabilities. Among these 18 projects, land sales as a share of total project income averages 76% (25%, to 97%, Right Panel, Figure 2). [2]
To accumulate enough project income other than land sales, projects are designed to operate in a long period. **Among the above 34 projects, the minimum operating period lasts to 2037, while many extends to 2051 (medium 2046). This translates into an operating period of 15 to 30 years, which brings challenges to income forecasts.** Will occupancy of parking spaces, offices, and advertising banners grow according to the PID assumptions? Will the land prices increase stably as the PID predicted?[3] The accuracy and sensitivity of assumptions are critical to projects’ financial sustainability, but this falls beyond the scope of this paper.
2. Implicit Debt embedded in PIEs’ Equity Contribution May Impair Financial Sustainability
Although current PIDs’ sustainability analysis focuses only on project borrowings associated with LG-PBs, they may not cover all project debt fundings. PIDs categorize project funding sources into “Equity” and “Debt” (Figure 3). Equity is further divided into “fiscal equity contribution” and “PIEs’ equity contribution”[4], while Debt is broken down as “borrowings from LG-PBs “ and “borrowings from the financial market”. For most projects, “fiscal equity contribution” and “borrowings from the financial market” are zero, which leaves most fundings to PIEs’ equity contribution and borrowings from LG-PBs.[5]** This means that if a PIE finances its equity contribution through bank loans or corporate bonds, the cost of financing will appear on its own balance sheet or income statement, not on those of the project.**
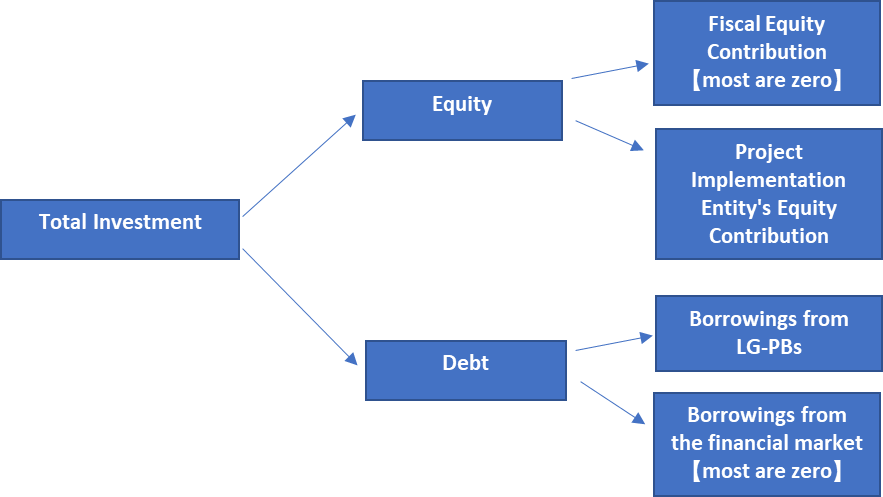
Figure 3 Sources of project investment
Source: Author’s analysis based on Project Introductory Documents.
The share of borrowings from the LG-PBs of total investment is moderate. Among the above 34 projects, the share ranges between 2% and 78%, with a median of 24% and half of the projects falling in the range between 15% and 40% (Figure 4). The rest is contributed by PIE’s equity contribution, which includes project subsidy from the central government (for only selected projects), PIEs’ retained earnings, PIEs’ equity-offering (which is local governments’ fiscal expenditure in the form of capital injection in SOEs), and the PIEs’ bond issuance/bank borrowings. Therefore, a project’s actual borrowing is made up of both explicit debt (in the form of LG-PBs) and implicit borrowings (in PIE’s equity contribution).
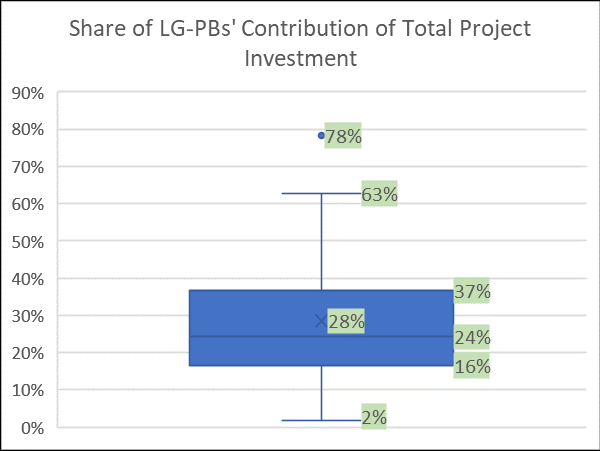
Figure 4 Boxplot for the share of LG-PBs’ contribution among total project investment
Source: Author’s calculation based on Project Introductory Documents.
Whether PIEs’ equity contribution involves with hidden debt depends on their liability-asset structure. According to the project introduction, most of 34 projects are implemented by Chengtou firms owned by the prefecture-level governments. Data compiled by GF Securities show that Chengtou firms in the CQ area accumulates about RMB 0.43 worth of interest-bearing liabilities for every RMB 1 worth of assets (median:42.7%, half of them ranging between 33.6%. and 52.2%. $^{\mathrm{2 }}$ As Chengtou firms usually have little profits, if the project income net LG-PB repayments cannot cover debt repayment hidden in PIEs’ equity contribution, financial stress even crisis may emerge in the future when macro-financial conditions tighten.
Unfortunately, the structure of PIEs’ equity contribution is not disclosed in the PIDs. To quantify the scale of hidden debt, this paper assumes that 40% of the PIE’s equity contribution relies on debt (at an annual interest rate of 4.7% and maturing when the project operation period expires).
Calculations show that once the financing cost of hidden debt is included, most projects’ income will be inadequate to repay liabilities.$^{\mathrm{3}}$ Without hidden debt, half of projects’ net cash flows (project income net operating and maintenance costs, taxes, and principal and interest repayment of debt) ranges from RMB 90 million RMB 370 million, with a median RMB 190 million (Left Panel, Figure 5). However, including the repayment of hidden debt, the net cash flows will fall to the range of RMB -1.37 billion RMB -190 million, with a median of RMB -600 million (Right Panel, Figure 5). Without external fundings or subsidies, only 2 out of the 34 projects have sufficient cash flows to repay all debt.
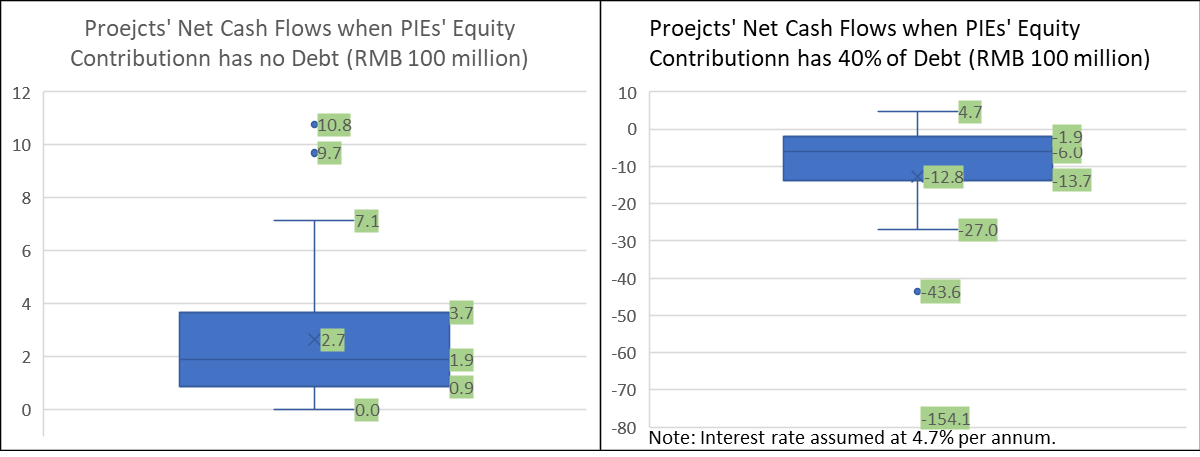
Figure 5 Boxplot for the project net Cashflows with or without hidden debt
Source: Author’s calculation based on Project Introductory Documents.
Since the reform in 2014, the central government of China has been building a firewall separating the debt of local governments and SOEs owned by local governments. Therefore, explicitly, borrowings from LG-PBs are the only fiscal obligations of projects, while that hidden in PIEs’ equity contribution should be settled by PIEs’ own operations. However, given that most projects are implemented by Chengtou firms, which are fully owned by local governments and operating infrastructure assets associated with public welfare, it hardly convincing that local governments would simply let Chengtou firms in financial stress to go bankrupt and ask debt holders to liquidate its assets.
Rather, if local governments decided to rescue Chengtou firms, additional fiscal resources would be needed, which forms an implicit and conditional fiscal burden. The scale of the above-mentioned implicit fiscal burden can be considerate. Take FL, which is a prefecture-level region under CQ, as an example. 9 out of the 34 projects are located in FL, with LG-PBs contribution totaling RMB 6.6 billion.After repaying LG-PBs’ principals and interests, the 9 projects accumulate net cashflows of RMB 2.58 billion. However, if the hidden debt repayment is included, they will accrue a deficit of amounting RMB 12.1 billion, which is 1.05 times of FL’s fiscal revenue in 2020.
3. Extending the Operating Period or Rolling over Debt Cannot Solve All the Problems
One way to accumulate more project income is to extend the operating period, but this solution may not work for many projects as the annual project operating income, such as collecting parking fees, leasing offices and apartments, leasing advertising banners, collecting theme park tickets (but excluding land sales), is too low . Half of the above 34 projects records an annual net operating income between RMB 7 million to 60 RMB million (median: 29 million yuan, left panel of Figure 6), compares with hundreds of millions of principal and interest expenses.
The right panel of Figure 7 shows the extra years needed for the accumulated operating income to cover both explicit and hidden debt burden, which is calculated by dividing the cash flow deficits in the right panel of Figure 6 by the annual operating net income in the left panel of Figure 7. It shows that half of the 34 projects should operate for another 20 years to meet the debt obligations, which is hardly feasible in engineering and economic senses.
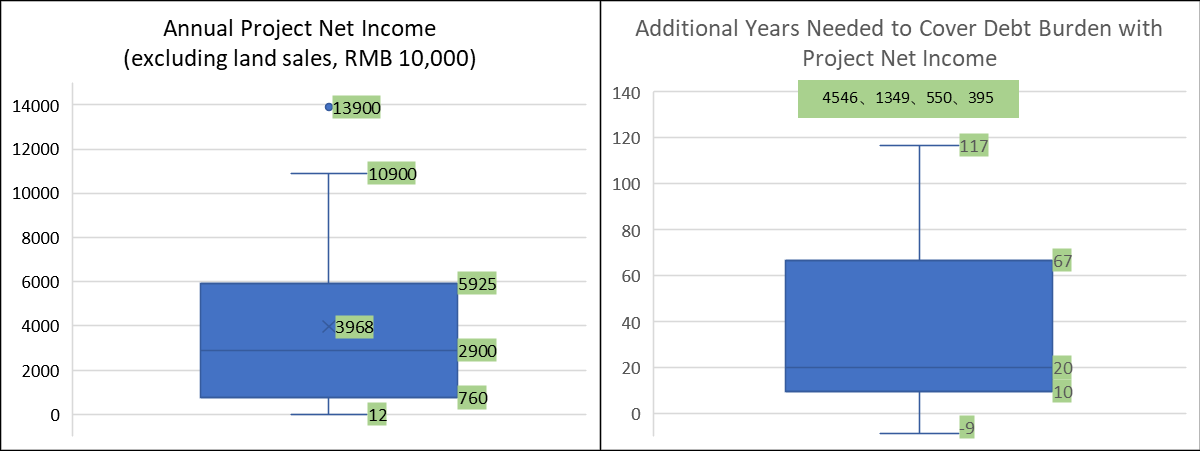
Figure 6 Boxplot for the annual project net income (left panel) and the years of extension needed to cover debt burden with project net income (excluding land sales)
Source: Author’s calculation based on Project Introductory Documents.
Meanwhile, debt rollover is also not a panacea. **Figure 7 compares projects’ net cashflows for various debt rollover schemes. If local governments can renew LG-PB’s principal, half of the projects will be able to fully finance debt obligations (orange box in Figure 7). If the PIE is able to extend its own borrowings (pushing back principal payments), a smaller number of projects will be able to meet its obligations (grey box in Figure 7). Lastly, even if the principals of all the debt are rolled over, more than half of the projects are still not able to have positive cash flows (yellow box in Figure 7).
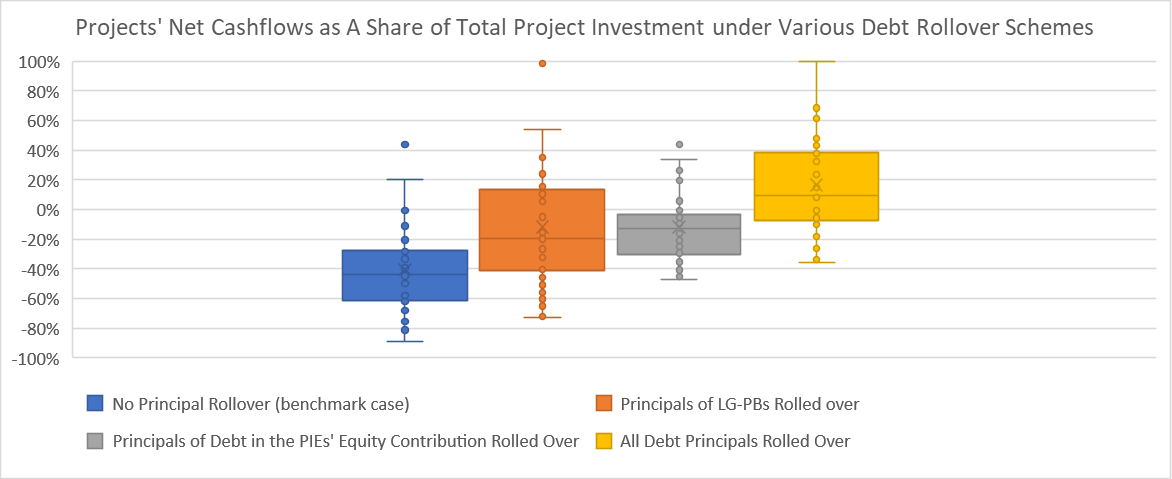
Figure 7 Projects’ Net Cashflows as A Share of Total Project Investment under Various Debt Rollover Schemes
Source: Author’s calculation based on Project Introductory Documents.
4. Summary
High-quality infrastructure projects can generate considerable social and economic impacts, but financial unviability may lead to implementation inefficiencies, lack of maintenance, waste in financial resources, and even local government fiscal crisis.
While much progress has been made to regulate local government financing, the financial analysis framework associated with LG-PBs requires upgrading. Specifically, considering that most of the projects are implemented by Chengtou firms owned by SOEs, a PIE needs to clarify whether its project equity contribution contains debt proceeds and, if so, how it plans to repay associated principals and interests.** In other words, the financial sustainability of projects can only be achieved if project income covers both explicit debt (in the form of LG-PBs) and hidden debt (embedded in PIEs’ equity contribution).**
In practice, most Chengtou firms consolidate all borrowings it bears into a liquidity pool, which makes it hard to quantify the project-based equity ratio. In this case, Chengtou firms should declare its Weighted Average Cost of Capital (WACC) and associated financing cost for its project equity contribution. Given this, a project can only achieve financial sustainability if the project income (net LG-PBs repayment) exceeds Chengtou firm’s financing cost.
Otherwise, when structuring and preparing the project, Finance Department of the local government should consider finding another PIE with a lower WACC, increase fiscal equity contribution, or provide operating subsidies. Indeed, these measures requires additional fiscal resources, but they are simply making the implicit and conditional fiscal burden explicit, which are in line with the regulating principles of the central government.
If all those seems not feasible, the project should be redesigned to lower the total investment or postponed to a later stage when fiscal resources are more abundant.
Notes and References
-
Ministry of Finance of the People’s Republic of China, 2022, “Local Government Bond Issuance and Debt Balance in June 2022”, http://yss.mof.gov.cn/zhuantilanmu/dfzgl/sjtj/202207/t20220726_3829548.htm
-
However, it is worth pointing out that, for some projects, land sales are front-loaded at the beginning of projects (in 2022 to 2024), well ahead of LG-PB maturity. This maturity mis-match may invite two issues: 1) the land sales proceeds may be relocated for other fiscal expenditures, leaving LG-PBs uncovered; 2) the proceeds may be injected to the PIE (Chengtou) in the form of Additional SOE Equity Contribution, with the PIE in turn injecting them to the project as equity contribution.
-
All 18 projects with land sales assume that land price will grow 6% per annum in 2022-2029, 3% in 2030-2039, and 1.5% in 2040-2049.
-
The actual category label is “Other Equity Contribution, including PIEs’ own-fundings or contributions from private partners), but in practice most of are PIEs’ contribution.
-
Among the above 34 projects, only 1 project relied on fiscal equity contribution and 1 project used bank borrowings (at 5-year Loan Primate Rate).