Disclaimer: This personal research note may contain errors and is provided for reference only.
Note: This note is generated based on this report deck
Contents
- Executive summary
- 1. Modelling a BRICS currency basket based on the IMF SDR
- 2. Historical presence in global trade and finance
- 3. Weighting schemes
- 4. Evaluating the basket
- Data and methodological caveats
Executive summary
This note develops a currency basket comprising the Brazilian real (BRL), Russian ruble (RUB), Indian rupee (INR), Chinese yuan (CNY, or renminbi), and South African rand (ZAR).
The weights are modelled on the International Monetary Fund’s Special Drawing Rights (SDR) basket and incorporate international trade and financial variables. Exports, outstanding international debt, and foreign-exchange turnover can be replicated directly. Where currency-level data are unavailable, the note uses the following proxies:
- Official reserves: foreign ownership of BRICS countries’ local-currency government debt.
- International banking liabilities: resident banks’ cross-border claims and liabilities denominated in their domestic currencies.
Across the variables, the Chinese yuan has the strongest international presence. Applying the adapted SDR methodology produces a basket dominated by CNY, with INR a distant second, followed by BRL, RUB, and ZAR.
The resulting basket broadly tracks BRICS-5 currency movements against the US dollar between 2020 and 2026. Its daily changes are centered around zero, and its volatility is comparable to that of CNY and INR and lower than that of BRL, RUB, and ZAR.
1. Modelling a BRICS currency basket based on the IMF SDR
1.1 How SDR weights are determined
According to the IMF’s Review of the Method of Valuation of the SDR, a currency’s relative share in the SDR basket is determined by its country’s share in exports and the currency’s share across several financial indicators.
| Category | Indicator | Weight | Source |
|---|---|---|---|
| Exports | A country’s share of exports of goods and services, in nominal SDR terms and excluding intra-EU trade | 1/2 | IMF and European Central Bank |
| Financial | A currency’s share of central-bank official reserves | 1/6 | IMF COFER survey |
| Financial | A currency’s share of foreign-exchange turnover | 1/6 | BIS Triennial Central Bank Survey |
| Financial | A currency’s share of international banking liabilities and outstanding international debt securities | 1/6 | BIS Locational Banking Statistics and Debt Securities Statistics |
1.2 The SDR weight formula
For currency (i), the adapted formula is:

1.3 Replication feasibility
Exports
Data are available for all five founding BRICS members from the World Bank’s World Development Indicators. The measure can be broadened to include both exports and imports, which may better capture a country’s role in international trade.
Official reserves
Currency-level data are not separately available for BRL, RUB, INR, and ZAR in the IMF COFER survey. The proxy used here is foreign ownership of each country’s local-currency government debt, based on IIF data. Because official reserves are generally invested in liquid assets such as bank deposits and treasury securities, greater foreign ownership may indicate a larger potential reserve-currency role.
Foreign-exchange turnover
Data are available for all five currencies from the BIS Triennial Central Bank Survey.
International banking liabilities
Currency-level data are not separately available for BRL, RUB, INR, and ZAR. The proxy used here is each country’s cross-border claims and liabilities denominated in its domestic currency. Including claims alongside liabilities partially captures offshore local-currency assets that would otherwise be excluded.
International debt securities
Data are available for all five currencies from the BIS International Debt Securities database.
2. Historical presence in global trade and finance
2.1 Exports
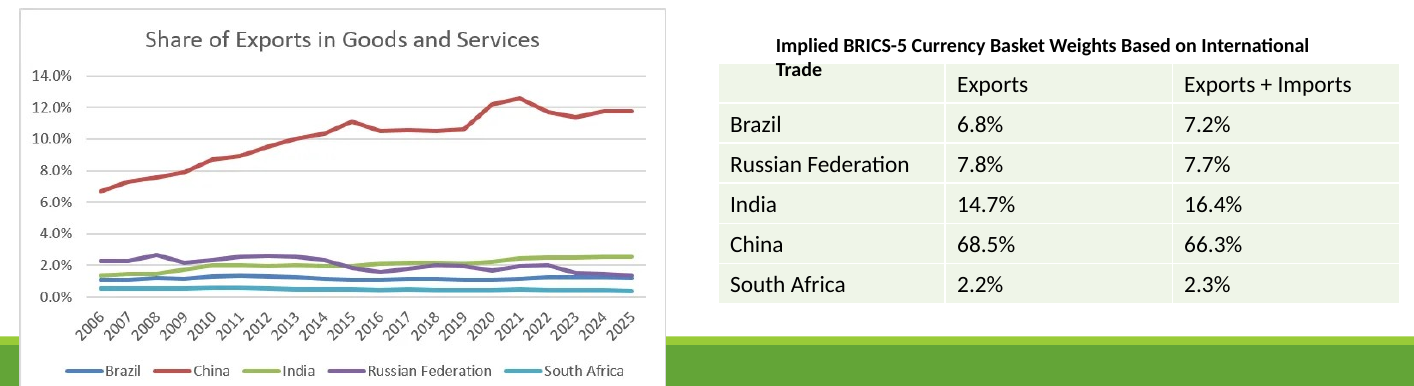
China has had the largest share of global exports among the BRICS-5 over the past two decades. Its share stood at 11.8% in 2025. India’s share trended upward to 2.5%, while Russia’s declined to 1.3%. Brazil and South Africa were comparatively stable at 1.2% and 0.4%, respectively.
Adding imports changes the countries’ relative weights only marginally: China’s implied weight falls by about 2 percentage points and India’s rises by a similar amount.
2.2 Foreign ownership of local-currency government debt
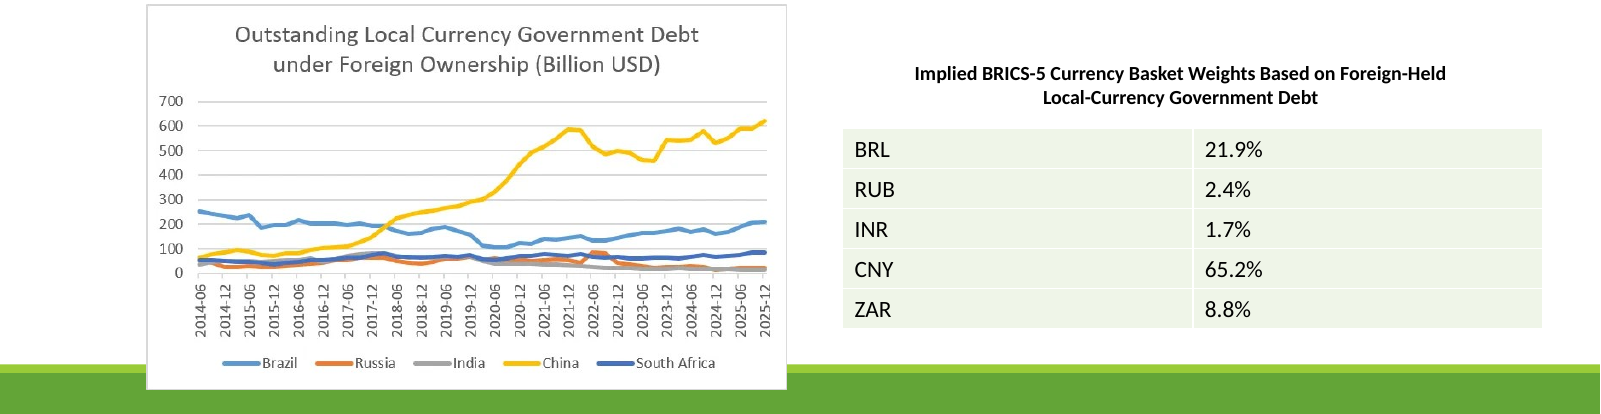
Foreign holdings are estimated by multiplying outstanding local-currency government debt by the foreign-ownership share, with both inputs sourced from the IIF.
China overtook Brazil in 2018. At the end of 2025, foreign holdings were USD 621 billion for China, USD 209 billion for Brazil, USD 84 billion for South Africa, USD 23 billion for India, and USD 16 billion for Russia.
2.3 Foreign-exchange turnover
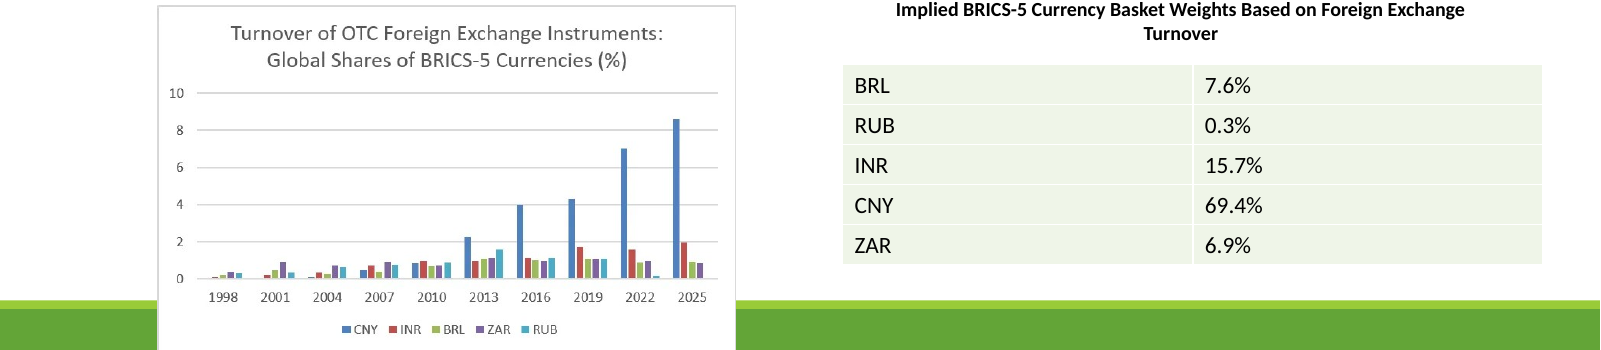
The BIS Triennial Central Bank Survey provides a currency breakdown of global FX turnover. Among BRICS-5 currencies, CNY had the largest share in 2025 at 8.6%, followed by INR at 1.95%, BRL at 0.94%, ZAR at 0.86%, and RUB at 0.04%.
2.4 International debt outstanding
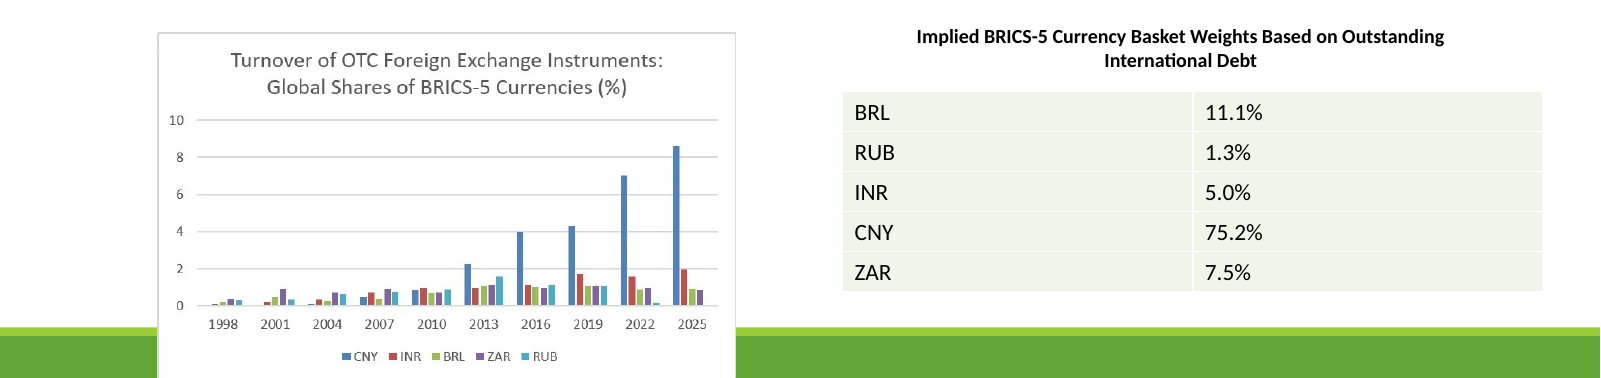
Under the BIS definition, international debt comprises debt securities issued outside the local market of the country where the borrower resides. At the end of Q1 2026, CNY-denominated international debt represented 0.94% of the global total, the highest share among the BRICS-5 currencies.
The corresponding global shares were 0.14% for BRL, 0.09% for ZAR, 0.06% for INR, and 0.02% for RUB.
2.5 Resident banks’ cross-border local-currency positions
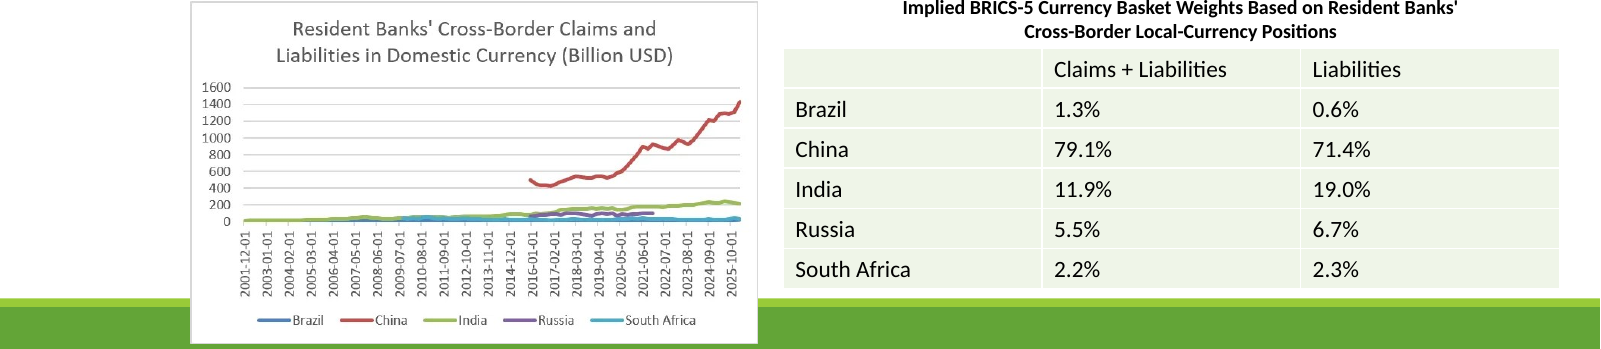
At the end of Q1 2026, banks resident in China had USD 1.4 trillion equivalent in cross-border claims and liabilities denominated in CNY. India ranked second at USD 214 billion. South Africa and Brazil recorded USD 39 billion and USD 24 billion, respectively.
Russia stopped publishing the relevant data in 2022. For calculation purposes, the amount is held constant thereafter.
2.6 Summary of implied weights
CNY has the strongest international presence across all measures, with implied weights ranging from approximately 65% to 80%. INR ranks second in trade, FX turnover, and cross-border banking. BRL ranks relatively high in international debt and foreign ownership of local-currency government debt.
| Currency | FX turnover | International debt | Banking: claims + liabilities | Banking: liabilities | Government debt | Exports | Exports + imports |
|---|---|---|---|---|---|---|---|
| BRL | 7.6% | 11.1% | 1.3% | 0.6% | 21.9% | 6.8% | 7.2% |
| RUB | 0.3% | 1.3% | 5.5% | 6.7% | 2.4% | 7.8% | 7.7% |
| INR | 15.7% | 5.0% | 11.9% | 19.0% | 1.7% | 14.7% | 16.4% |
| CNY | 69.4% | 75.2% | 79.1% | 71.4% | 65.2% | 68.5% | 66.3% |
| ZAR | 6.9% | 7.5% | 2.2% | 2.3% | 8.8% | 2.2% | 2.3% |
3. Weighting schemes
Two basket specifications are considered:
\[\text{Basket 1: } W_i = 0.5\left(\frac{A+B+C+E}{4}\right) + 0.5F\] \[\text{Basket 2: } W_i = 0.5\left(\frac{A+B+D+E}{4}\right) + 0.5G\]where A is FX turnover, B is international debt, C is cross-border claims plus liabilities, D is cross-border liabilities, E is foreign ownership of local-currency government debt, F is exports, and G is exports plus imports.
Basket 2 is slightly less concentrated and is used as the default in the subsequent analysis. Setting the basket’s face value at USD 10 on 24 August 2026 using that day’s exchange rates gives the following currency amounts:
| Currency | Amount |
|---|---|
| BRL | 4.5 |
| RUB | 43.2 |
| INR | 128.1 |
| CNY | 46.3 |
| ZAR | 7.0 |
4. Evaluating the basket
4.1 Exchange rates against the US dollar
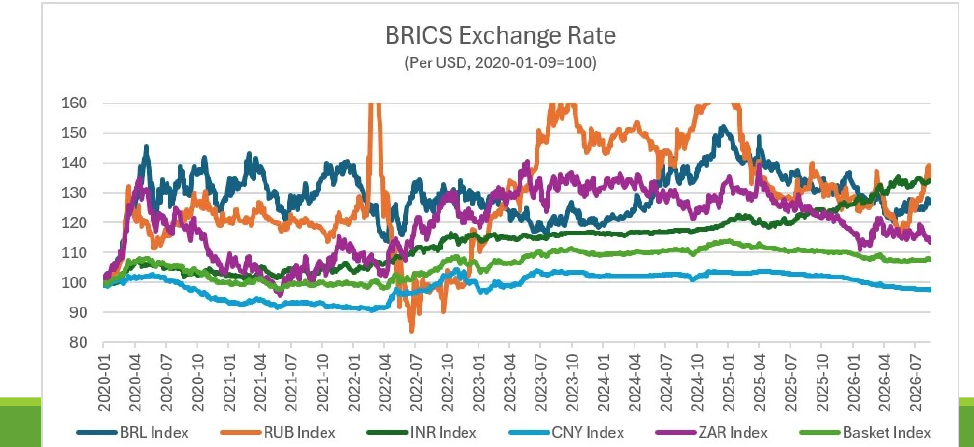
The series index each BRICS-5 currency and the basket, expressed per US dollar, to January 2020. Apart from RUB movements in 2022 and 2023, the currencies broadly followed similar trends. RUB, ZAR, and BRL varied more than INR and CNY.
The basket varies less than the individual currencies and captures their broad direction, although its movement is more heavily influenced by CNY.
4.2 Distribution of daily percentage changes
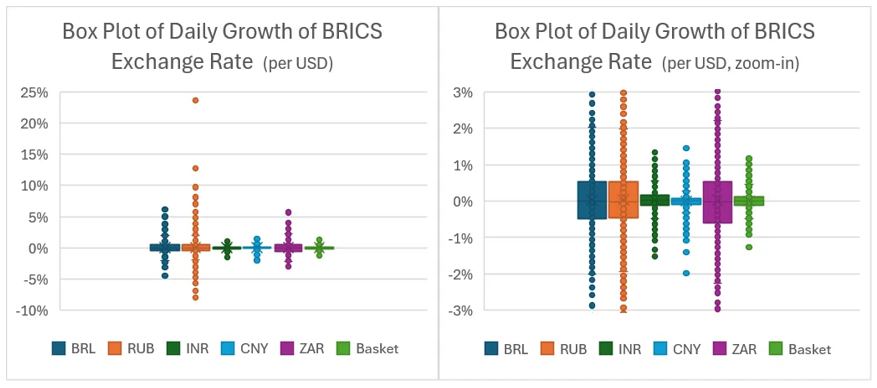
Daily percentage changes for all five currencies and the basket are centered around zero. The distributions of the basket, CNY, and INR are symmetric, whereas BRL, RUB, and ZAR are skewed toward depreciation.
The basket’s interquartile range is 0.236 percentage points. This is larger than CNY’s 0.150, comparable to INR’s 0.260, and smaller than BRL’s 1.011, RUB’s 0.986, and ZAR’s 1.125.
4.3 Volatility of daily percentage changes
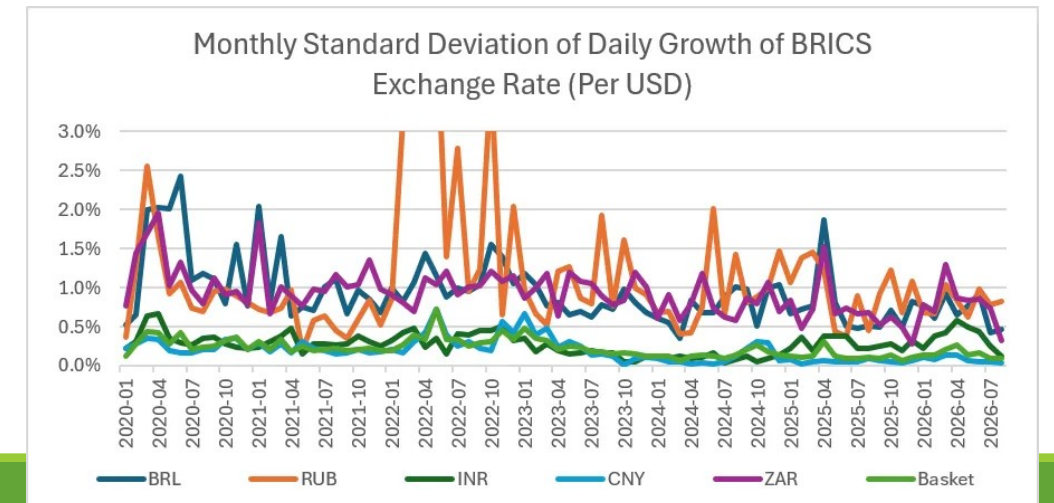
The basket’s exchange-rate volatility against the US dollar is comparable to that of CNY and INR. The five-year averages of monthly standard deviations are 0.22% for the basket, 0.19% for CNY, and 0.27% for INR.
The basket is considerably less volatile than BRL, RUB, and ZAR, whose corresponding averages are 0.93%, 1.16%, and 0.93%.
Data and methodological caveats
- Currency-level official-reserve data are unavailable for four of the five currencies, requiring a proxy based on foreign holdings of local-currency government debt.
- Currency-level international banking liabilities are similarly unavailable, so resident banks’ cross-border local-currency positions are used.
- Russia’s banking series is held constant after publication stopped in 2022.
- The basket is an analytical experiment, not an official BRICS proposal or financial product.
- Results depend on the chosen proxies, data vintages, normalization, and weighting specification.
Source databases
- IMF: Review of the Method of Valuation of the SDR
- World Bank, World Development Indicators
- IMF, Currency Composition of Official Foreign Exchange Reserves
- BIS, Triennial Central Bank Survey
- BIS, Locational Banking Statistics
- BIS, International Debt Securities Statistics
- Institute of International Finance
